Lab Results
HbA1c and Fasting Glucose: Your Complete Guide to Blood Sugar Markers
Most people only hear about their HbA1c after a diabetes diagnosis — but by then, blood sugar dysregulation has often been building for years. Understanding what your HbA1c and fasting glucose results actually mean, and where the optimal ranges truly sit, can help you intervene before the damage is done. This guide breaks down every key blood sugar marker, what the research says about ideal targets, and how to translate your lab results into action.
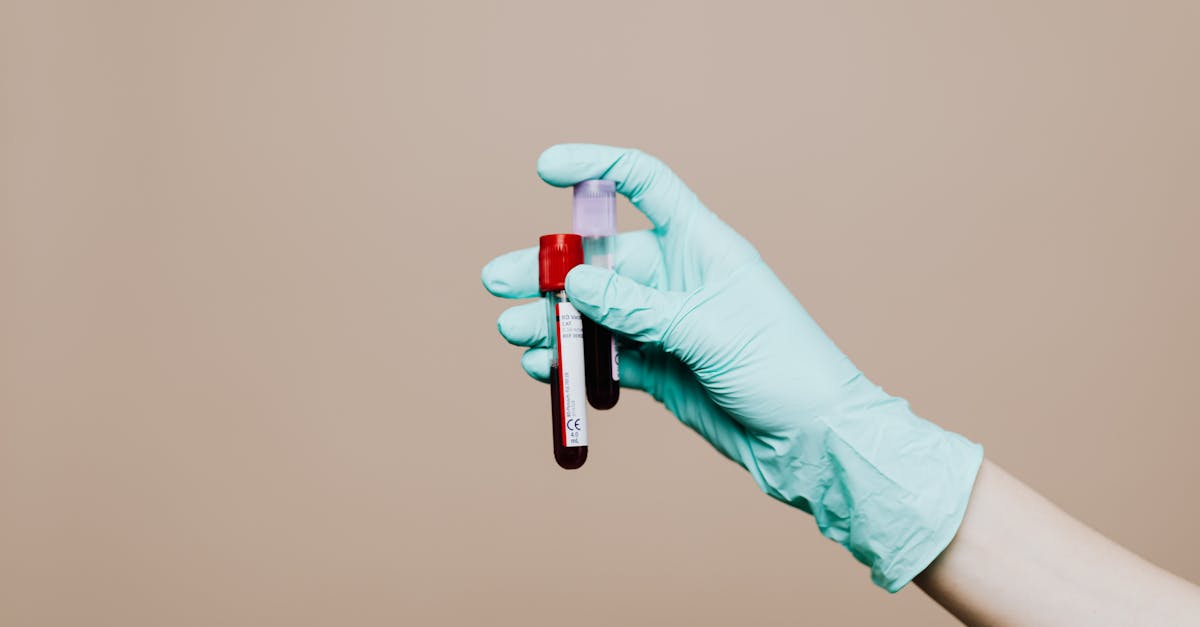
HbA1c and Fasting Glucose: Your Complete Guide to Blood Sugar Markers
Blood sugar is one of the most consequential — and most misread — panels in routine lab work. A result that falls inside the "normal" reference range on a standard lab report can still represent years of metabolic drift. Conversely, a mildly elevated reading may respond rapidly to targeted nutrition, lifestyle, and supplementation. Whether you've just received your first lab panel or you're trying to fine-tune a result that's been creeping upward, this guide will give you a clear, evidence-based framework for interpreting your HbA1c blood test results alongside your fasting glucose — and understanding what to do next.
---
Blood Sugar Markers Explained: HbA1c, Fasting Glucose, and Beyond
Before diving into ranges, it helps to understand what each marker is actually measuring — because they capture different time windows and different aspects of glucose metabolism.
Hemoglobin A1c (HbA1c) reflects the percentage of hemoglobin molecules in your red blood cells that have been glycated (bonded to glucose) over approximately the past 90–120 days. Because red blood cells live roughly three months, HbA1c acts as a rolling average of blood sugar exposure. It doesn't tell you what your glucose is doing right now; it tells you what it has been doing chronically. This is why the American Diabetes Association (ADA) uses it as a primary diagnostic tool for prediabetes and type 2 diabetes (American Diabetes Association, Diabetes Care 2024 Standards of Care; doi.org/10.2337/dc24-S002).
Fasting plasma glucose (FPG) is a point-in-time measurement taken after at least 8 hours without caloric intake. It primarily reflects hepatic glucose output — how aggressively your liver is releasing glucose into the blood between meals. Elevated fasting glucose, even before HbA1c climbs, can signal early insulin resistance at the liver.
Fasting insulin is not always ordered but is critically important context. Normal fasting glucose alongside elevated fasting insulin suggests the pancreas is working overtime to compensate — a pattern called compensated insulin resistance that can precede glucose abnormalities by a decade (Tabák et al., The Lancet 2012; PMID: 22683128).
Postprandial glucose (2-hour glucose after a meal or oral glucose tolerance test) catches cases where fasting glucose looks fine but glucose clearance is impaired. Many functional medicine practitioners consider it one of the most sensitive early markers.
Together, these markers tell a full story. Relying on HbA1c alone — the way most annual physicals are run — misses a significant proportion of people with early metabolic dysfunction.
---
Fasting Glucose Optimal Range: What the Research Actually Shows
Conventional lab reference ranges label fasting glucose as "normal" up to 99 mg/dL and "prediabetic" from 100–125 mg/dL. But the research on cardiovascular and cognitive risk paints a more nuanced picture.
A large prospective analysis of over 46,000 participants in the Whitehall II study found that fasting glucose levels in the 95–99 mg/dL range — technically "normal" — were associated with a meaningfully higher progression to type 2 diabetes over 10 years compared to those below 90 mg/dL (Tabák et al., The Lancet 2012; PMID: 22683128). The risk isn't binary at the 100 mg/dL cutoff; it rises on a continuum.
For cognitive health, a 2018 analysis in Diabetologia found that higher fasting glucose within the normal range was independently associated with accelerated cognitive decline, even after adjusting for diabetes status (Ravona-Springer et al., Diabetologia 2018; PMID: 29435591).
Practical optimal targets, according to functional and integrative medicine practitioners:
| Marker | Conventional Normal | Optimal Functional Range |
|---|---|---|
| Fasting glucose | 70–99 mg/dL | 72–90 mg/dL |
| Fasting insulin | < 25 µIU/mL | < 8 µIU/mL |
| 2-hour postprandial glucose | < 140 mg/dL | < 120 mg/dL |
| HbA1c | < 5.7% | 4.8–5.4% |
These tighter targets aren't about fear — they're about preserving metabolic flexibility and reducing long-term risk before pathology sets in. Understanding your blood glucose and insulin resistance markers as a system, rather than checking individual boxes, is the key shift.
---
Pre-Diabetic HbA1c: What the 5.7–6.4% Range Really Means
The ADA defines prediabetes as an HbA1c between 5.7% and 6.4%. The CDC estimates that over 96 million American adults — more than 1 in 3 — fall into this range, and the vast majority don't know it (CDC National Diabetes Statistics Report, 2022). This is not a trivial finding: prediabetes is not simply "almost diabetes" that can be ignored. It already carries independent risk.
A meta-analysis of 53 prospective cohort studies published in BMJ in 2016 found that prediabetes — defined by either impaired fasting glucose or impaired glucose tolerance — was significantly associated with increased risk of cardiovascular disease, coronary heart disease, stroke, and all-cause mortality, independent of progression to diabetes (Huang et al., BMJ 2016; PMID: 27881363).
The good news is that the pre-diabetic range is also where intervention has the largest impact. The landmark Diabetes Prevention Program (DPP) randomized controlled trial demonstrated that lifestyle intervention (modest weight loss + 150 minutes of weekly activity) reduced progression from prediabetes to type 2 diabetes by 58% over 3 years, outperforming metformin (Knowler et al., NEJM 2002; PMID: 11832527). Nutritional support can further amplify those results.
Key questions to ask if your HbA1c is 5.7–6.4%:
- What is your fasting insulin? (Helps determine how much pancreatic compensation is occurring)
- What is your triglyceride-to-HDL ratio? (A ratio > 3.0 strongly predicts insulin resistance)
- What does your postprandial glucose look like 1–2 hours after a mixed meal?
- Are there inflammatory markers (hs-CRP, ferritin) elevated alongside glycemic markers?
Answering these questions turns a single number into an actionable picture. For a deeper look at how inflammation intersects with metabolic markers, understanding hs-CRP and inflammatory blood markers provides useful context.
---
HbA1c Blood Test Interpretation: Reading Your Full Result
When your HbA1c result comes back, several factors affect how to interpret it accurately.
Conditions that falsely lower HbA1c:
- Hemolytic anemia (faster red blood cell turnover means less time for glycation)
- Recent blood transfusion
- Iron deficiency anemia being treated with iron supplementation
- Pregnancy (expanded plasma volume)
Conditions that falsely raise HbA1c:
- Iron deficiency anemia (untreated — slower red cell turnover)
- Vitamin B12 or folate deficiency
- Certain hemoglobin variants (e.g., HbS, HbC)
- Splenectomy
When HbA1c seems inconsistent with fasting glucose or symptoms, a fructosamine test (which reflects a 2–3 week average) or continuous glucose monitoring (CGM) data can provide more accurate context.
HbA1c Interpretation Table:
| HbA1c Result | ADA Classification | Estimated Average Glucose (eAG) | Action Level |
|---|---|---|---|
| < 4.8% | Optimal (functional) | ~80 mg/dL | Maintain |
| 4.8–5.4% | Normal / optimal | ~80–108 mg/dL | Maintain / monitor |
| 5.5–5.6% | High-normal (watch) | ~111–114 mg/dL | Diet + lifestyle review |
| 5.7–6.4% | Prediabetes | ~117–137 mg/dL | Active intervention |
| 6.5%+ | Diabetes (presumptive) | ≥ 140 mg/dL | Medical management |
Estimated average glucose conversion uses the ADA formula: eAG (mg/dL) = 28.7 × HbA1c − 46.7 (Nathan et al., Diabetes Care 2008; PMID: 18540046).
---
Glucose Variability: The Marker Most Lab Panels Miss
HbA1c and fasting glucose are both averages or snapshots. They tell you nothing about the peaks and valleys your glucose experiences throughout the day — a concept called glucose variability (GV). Emerging evidence suggests that GV may matter independently of average glucose levels.
A 2018 study in Diabetes Care found that higher glycemic variability — measured by continuous glucose monitors — was associated with increased oxidative stress and endothelial dysfunction even in individuals without diabetes (Monnier et al., Diabetes Care 2006; PMID: 16644645). More recent work using CGM in non-diabetic populations has shown that a significant proportion of otherwise healthy people experience postprandial glucose spikes above 140 mg/dL after common meals — spikes that would never appear on a standard HbA1c panel (Hall et al., Nature Medicine 2018; PMID: 29311765).
For people who want a complete metabolic picture, pairing standard lab tests with even a brief period of continuous glucose monitoring (CGM) has become increasingly accessible. Consumer CGMs like Dexterity or Abbott Libre Sense are increasingly used outside clinical settings for this purpose.
High glucose variability warning signs (even with normal HbA1c):
- Energy crashes 1–2 hours after meals
- Strong carbohydrate cravings, especially in the afternoon
- Difficulty sleeping if a large meal was eaten late
- Brain fog or irritability before meals
- Triglycerides above 100 mg/dL with low HDL
---
What This Means for Your Formula: How Ones Addresses Blood Sugar Optimization
Once your HbA1c and fasting glucose data are in hand, the question becomes: what targeted nutritional support has genuine clinical evidence behind it? This is precisely where Ones uses your lab results to personalize your capsule formula — not guessing at generic supplements, but matching ingredients to your actual metabolic picture.
Three ingredients Ones commonly includes for blood sugar support, with clinical dosing:
1. Berberine (500mg, up to 1500mg/day)
Berberine is one of the most studied botanical compounds for glycemic regulation. A meta-analysis of 27 randomized controlled trials published in Evidence-Based Complementary and Alternative Medicine found that berberine significantly reduced HbA1c, fasting blood glucose, and postprandial glucose in patients with type 2 diabetes, with an effect size comparable to metformin in several head-to-head comparisons (Dong et al., Evidence-Based Complementary and Alternative Medicine 2012; PMID: 23118793). Ones doses berberine at clinically validated levels, matching the 500mg three-times-daily protocol used in leading trials.
2. Magnesium Glycinate (from Magnesium Complex)
Magnesium is a cofactor in over 300 enzymatic reactions, including glucose metabolism and insulin signaling. A 2011 meta-analysis in Diabetes Care found that higher dietary magnesium intake was associated with a significantly lower risk of type 2 diabetes (Dong et al., Diabetes Care 2011; PMID: 21310815). In individuals with prediabetes and low serum magnesium, supplementation with 365mg/day for 3 months significantly improved insulin sensitivity and HbA1c compared to placebo (Guerrero-Romero et al., Diabetes & Metabolism 2011; PMID: 21367648). Ones includes magnesium glycinate as part of its proprietary Magnesium Complex blend, a highly bioavailable form less likely to cause gastrointestinal side effects than magnesium oxide. You can explore the full evidence base for magnesium glycinate and metabolic health in our dedicated guide.
3. Chromium Picolinate
Chromium is an essential trace mineral that potentiates insulin action by enhancing insulin receptor signaling. A randomized double-blind placebo-controlled trial in 180 subjects with type 2 diabetes found that chromium picolinate at 500mcg and 1000mcg per day significantly reduced HbA1c, fasting glucose, and fasting insulin over 4 months compared to placebo (Anderson et al., Diabetes 1997; PMID: 9356027). Ones incorporates chromium picolinate in formulas flagged for elevated HbA1c or fasting glucose, at doses that mirror those used in clinical research.
For individuals with adrenal dysfunction contributing to cortisol-driven blood sugar elevation — a common but underrecognized pattern — Ones' Adrenal Support blend (including KSM-66 Ashwagandha at 600mg) may also be relevant. Chronic cortisol excess directly raises hepatic glucose output and impairs peripheral insulin sensitivity. Understanding the clinical evidence for ashwagandha in cortisol and metabolic regulation adds important context for people whose stress levels and blood sugar seem to move together.
Platforms like Thorne and Ritual offer quality individual supplements, but neither analyzes your specific HbA1c trajectory or fasting glucose trend to calibrate the formula. Viome focuses on gut microbiome analysis rather than blood metabolic markers. Ones uniquely combines lab-based glycemic data with wearable inputs — including sleep and activity patterns that are independently associated with glucose variability — to build a formula that's responsive to your actual metabolic state, not a population average.
For anyone tracking vitamin D3 levels and metabolic health, it's also worth noting that vitamin D deficiency has been independently associated with insulin resistance and higher HbA1c — another reason Ones often includes D3 + K2 (MK-7) in metabolic formulas.
---
Key Takeaways
- HbA1c reflects a 90–120 day average of blood glucose exposure — it's a chronic trend marker, not a real-time reading, and must be interpreted alongside fasting glucose, fasting insulin, and ideally postprandial data.
- The "normal" range is not the same as the optimal range: fasting glucose above 90 mg/dL and HbA1c above 5.4% carry increasing cardiometabolic and cognitive risk, even before crossing the prediabetes threshold.
- Prediabetes (HbA1c 5.7–6.4%) is reversible with targeted lifestyle and nutritional intervention — the Diabetes Prevention Program showed a 58% risk reduction through structured intervention, and emerging evidence for berberine, magnesium, and chromium supports further benefit.
- Glucose variability is a dimension HbA1c cannot capture — CGM data, postprandial symptoms, and the triglyceride/HDL ratio provide important supplementary signals.
- Conditions like anemia, B12 deficiency, and hemoglobin variants can distort HbA1c results in both directions — always interpret in clinical context.
- Ones uses your actual lab values — including HbA1c and fasting glucose trends — to build a personalized formula with clinically dosed ingredients like berberine, magnesium glycinate, and chromium picolinate, calibrated to your metabolic picture rather than generic recommendations.
---
This article is for educational purposes only and does not constitute medical advice. Consult a qualified healthcare provider before making changes to your supplement regimen or diabetes management plan.