Lab Results
How to Read Your Blood Test Results: A Plain-English Guide to Every Marker
Most people glance at their blood test results, see a wall of abbreviations and reference ranges, and hand the paper back to their doctor without asking a single question. But your lab work contains some of the most actionable health data available — if you know how to read it. This guide breaks down every major marker in plain English, explains what 'normal' versus 'optimal' really means, and shows how personalized supplementation can help you move your numbers in the right direction.
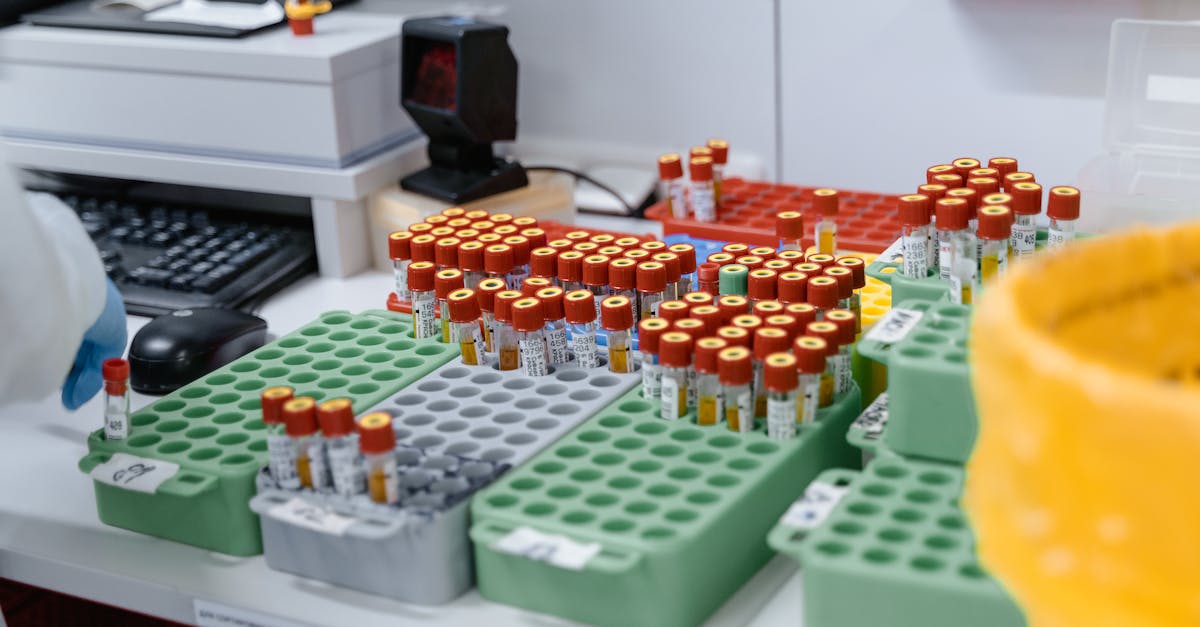
How to Read Your Blood Test Results: A Plain-English Guide to Every Marker
Your annual blood panel is one of the most underutilized tools in preventive health. Doctors spend an average of 18 minutes per appointment (Tai-Seale et al., Health Affairs 2017; PMID: 28679811), leaving little time to walk through a dozen lab values in any meaningful depth. The result? Most people leave the clinic knowing only whether they "passed" or "failed" — without understanding what their numbers actually mean, how far off optimal they are, or what they can do about it.
This guide changes that. We'll walk through the most important panels — the Complete Blood Count (CBC), the Comprehensive Metabolic Panel (CMP), lipids, thyroid, iron, vitamins, and inflammation markers — explain what each marker measures, define lab "normal" vs. true biological "optimal," and point you toward evidence-based actions you can take.
Understanding how to interpret your vitamin D levels and why optimal differs from normal is one example of how acting on your own lab data can have a meaningful impact on long-term health. The same logic applies across your entire panel.
---
Blood Test Markers Explained: The Basics of Reference Ranges
Before diving into specific tests, it helps to understand what a "reference range" actually is. Standard lab ranges are derived statistically: they represent the middle 95% of values in a tested population, not the range associated with lowest disease risk. That population often includes people who are already metabolically unhealthy — meaning "normal" can include a lot of suboptimal biology.
A classic example is fasting glucose. The conventional normal range tops out at 99 mg/dL. But large epidemiological studies show cardiovascular risk begins rising meaningfully at fasting glucose levels above 85–90 mg/dL (Levitan et al., Annals of Internal Medicine 2004; PMID: 15096330). Knowing the difference between a "normal" flag and an "optimal" target is the first step to using your lab work proactively.
Here's a quick framework:
| Term | What It Means |
|---|---|
| Reference Range | Statistical middle 95% of the tested population |
| Optimal Range | Associated with lowest disease risk in outcome studies |
| Flagged (H/L) | Outside the 95% reference interval — warrants attention |
| Borderline | Within range but outside optimal — often actionable |
---
CBC Interpretation: What Your Complete Blood Count Is Telling You
The CBC is the most commonly ordered blood test. It measures the three main cell types in your blood: red blood cells (RBCs), white blood cells (WBCs), and platelets.
Red Blood Cell Markers
- Hemoglobin (Hgb): The oxygen-carrying protein in red blood cells. Low hemoglobin indicates anemia; high levels can suggest dehydration or polycythemia. Optimal range for men: 14–17 g/dL; women: 12–15 g/dL.
- Hematocrit (Hct): The percentage of blood volume made up of red blood cells. Mirrors hemoglobin trends.
- MCV (Mean Corpuscular Volume): Measures the average size of your red blood cells. Low MCV suggests iron-deficiency anemia; high MCV suggests B12 or folate deficiency (macrocytic anemia).
- MCH / MCHC: The amount and concentration of hemoglobin in a single RBC. Useful for classifying anemia type.
- RDW (Red Cell Distribution Width): How much your red blood cells vary in size. Elevated RDW is an early and sensitive marker of iron, B12, or folate insufficiency, and is independently associated with all-cause mortality (Patel et al., Archives of Internal Medicine 2009; PMID: 19546418).
White Blood Cell Markers
The WBC differential tells you which immune cell types are elevated or suppressed:
| Cell Type | What Elevation May Indicate | What Low Levels May Indicate |
|---|---|---|
| Neutrophils | Bacterial infection, inflammation | Bone marrow issues, severe viral illness |
| Lymphocytes | Viral infection, immune activation | Chronic stress, HIV, autoimmunity |
| Monocytes | Chronic inflammation, autoimmunity | Rare; sometimes chemotherapy |
| Eosinophils | Allergic conditions, parasites, histamine load | Generally not concerning |
| Basophils | Allergic reaction, hypothyroidism | Rarely significant |
Platelets: Normal range is 150,000–400,000/µL. Low platelets (thrombocytopenia) increase bleeding risk; chronically high platelets may signal inflammation or iron deficiency.
---
Metabolic Panel Guide: Understanding Your CMP
The Comprehensive Metabolic Panel (CMP) covers kidney function, liver function, electrolytes, blood sugar, and protein status — 14 values in a single draw.
Blood Sugar
- Fasting Glucose: Optimal: 70–85 mg/dL. As noted above, risk begins rising above 85–90 mg/dL even within the "normal" range.
- HbA1c (usually ordered separately): Reflects average blood sugar over ~3 months. Optimal: below 5.4%. Pre-diabetes begins at 5.7%; diabetes at 6.5% (American Diabetes Association Standards of Care 2024; doi.org/10.2337/dc24-S002).
Kidney Function
- Creatinine & BUN (Blood Urea Nitrogen): Waste products filtered by the kidneys. High values suggest reduced kidney filtration. BUN/Creatinine ratio above 20 can indicate dehydration.
- eGFR (Estimated Glomerular Filtration Rate): The most direct estimate of kidney function. Above 90 mL/min/1.73m² is normal; below 60 for 3+ months signals chronic kidney disease.
- Electrolytes (Sodium, Potassium, Chloride, CO2/Bicarbonate): Tightly regulated. Imbalances are usually caused by medications, diet, or underlying disease — worth flagging with your provider.
Liver Function (LFTs)
- ALT (Alanine Aminotransferase) & AST (Aspartate Aminotransferase): Enzymes released when liver cells are damaged. Elevated levels signal liver stress from alcohol, fatty liver, medications, or other causes. Optimal ALT: below 25 U/L in women, below 33 U/L in men (Prati et al., Annals of Internal Medicine 2002; PMID: 12049962).
- ALP (Alkaline Phosphatase): Can be elevated in liver, bone, or thyroid disorders.
- Total Bilirubin: A breakdown product of red blood cells. Mildly elevated bilirubin (Gilbert's syndrome) is usually benign; significant elevation warrants investigation.
- Albumin & Total Protein: Markers of nutritional status and liver synthetic function. Low albumin is associated with inflammation and malnutrition.
For a deeper look at how liver enzymes connect to supplement choices, understanding liver support ingredients and what the clinical research shows can help you make informed decisions beyond just dietary changes.
---
Optimal Lab Ranges: Lipids, Thyroid, Iron, and Beyond
The panels above are just the beginning. A complete picture of your metabolic health typically requires several additional tests that aren't always included in a standard annual panel.
Lipid Panel
| Marker | Conventional Normal | Optimal (Outcomes-Based) |
|---|---|---|
| Total Cholesterol | < 200 mg/dL | Context-dependent |
| LDL-C | < 130 mg/dL | < 100 mg/dL (general); < 70 if high-risk) |
| HDL-C | > 40 (men), > 50 (women) | > 60 mg/dL |
| Triglycerides | < 150 mg/dL | < 100 mg/dL |
| Non-HDL Cholesterol | < 160 mg/dL | < 130 mg/dL |
Triglycerides are particularly actionable through diet and supplementation. Omega-3 fatty acids (EPA + DHA) have been shown in randomized controlled trials to reduce triglycerides by 20–30% at doses of 2–4 grams per day (Miller et al., Journal of Clinical Lipidology 2011; PMID: 21392722). Understanding the optimal omega-3 EPA/DHA ratio for cardiovascular benefit is essential context for anyone with elevated triglycerides.
Thyroid Panel
- TSH (Thyroid Stimulating Hormone): The primary screening marker. Conventional range: 0.4–4.5 mIU/L. Many functional practitioners target 1.0–2.5 mIU/L for optimal thyroid activity.
- Free T4 & Free T3: Measure the active and circulating forms of thyroid hormone. Free T3 is the metabolically active form; it may be low even when TSH appears normal.
- Thyroid Antibodies (TPO-Ab, TG-Ab): Elevated antibodies indicate Hashimoto's thyroiditis, the most common autoimmune thyroid condition.
Iron Panel
- Serum Ferritin: The stored form of iron. Conventional normal bottoms out at 12–20 ng/mL, but research links fatigue and cognitive symptoms to ferritin below 30–50 ng/mL (Vaucher et al., CMAJ 2012; PMID: 22271638). Optimal for most adults: 50–150 ng/mL.
- Serum Iron & TIBC (Total Iron Binding Capacity): Together these calculate transferrin saturation — a useful measure of iron availability. Optimal saturation: 25–35%.
Inflammation and Cardiometabolic Markers
- hsCRP (High-Sensitivity C-Reactive Protein): A sensitive marker of systemic inflammation. Below 1.0 mg/L is optimal; above 3.0 mg/L signals elevated cardiovascular risk (Ridker, Circulation 2003; PMID: 12821543).
- Homocysteine: An amino acid elevated by B12, folate, or B6 insufficiency. Levels above 10 µmol/L are associated with increased cardiovascular and cognitive risk (Seshadri et al., NEJM 2002; PMID: 11794182).
- Vitamin D (25-OH): Conventional sufficiency starts at 20 ng/mL, but immunological and musculoskeletal benefits are more consistently seen above 40–60 ng/mL (Holick et al., Journal of Clinical Endocrinology & Metabolism 2011; PMID: 21646368).
- Fasting Insulin: Not on most standard panels but highly informative. Optimal fasting insulin is below 5 µIU/mL; above 10 suggests early insulin resistance, often years before glucose becomes abnormal.
---
How Ones Addresses This: Turning Your Lab Data into a Personalized Formula
Reading your labs is only step one. Acting on them with precision is where most people — and most supplement products — fall short. Ones was built specifically to close that gap.
The Ones AI health practitioner ingests your blood work, wearable data, and health history, then builds a custom capsule formula from over 200 clinically validated ingredients. Here's how it addresses the markers covered in this guide:
Vitamin D3 + K2 (MK-7): If your 25-OH Vitamin D is below 40 ng/mL — where the majority of adults sit — Ones includes therapeutic-dose D3 paired with MK-7 (the most bioavailable form of K2). K2 is critical because it directs calcium away from arterial walls and toward bone, a safety consideration that standard vitamin D supplements often ignore. This pairing is supported by evidence from Knapen et al. (Osteoporosis International 2013; PMID: 23525894).
Omega-3 (EPA/DHA): For users with triglycerides above 100 mg/dL or low HDL, Ones includes concentrated EPA/DHA dosed to clinically meaningful ranges. The AHA recognizes omega-3 supplementation as evidence-based for triglyceride reduction (American Heart Association Scientific Statement; doi.org/10.1161/CIR.0000000000000709).
Magnesium Glycinate: Magnesium is a cofactor in over 300 enzymatic reactions, including glucose metabolism and blood pressure regulation (Nielsen, Nutrients 2018; PMID: 29387044). Serum magnesium is notoriously unreliable as a marker (only 1% of body magnesium is in blood), so low intake is dramatically underdetected. Ones uses the glycinate chelate — the most bioavailable and gut-tolerant form — within its Magnesium Complex, formulated for users whose metabolic or sleep markers suggest insufficiency.
For users whose CBC reveals elevated RDW or low MCV, the formula may also incorporate methylated B12 and methylfolate at therapeutic doses — the active forms that bypass common MTHFR gene variants that impair standard folic acid metabolism. This precision in form selection is something generic multivitamins and even platforms like Ritual (which uses a single multi format) cannot offer. Similarly, Thorne offers practitioner-grade single ingredients, but without the AI-driven cross-referencing of your actual lab values against clinical thresholds.
Formulas come in 6, 9, or 12-capsule plans, allowing the system to prioritize your most actionable deficiencies within a realistic daily capsule budget.
---
Key Takeaways
- "Normal" is not the same as "optimal." Lab reference ranges are statistical constructs — outcomes research consistently shows the healthiest values sit within narrower ranges than most reports flag.
- Your CBC tells you far more than whether you're anemic. RDW, MCV, and the WBC differential are early-warning signals for nutrient insufficiency and immune stress.
- The CMP covers kidney, liver, electrolyte, and blood sugar function — all of which interact with how you absorb and utilize nutrients.
- Triglycerides, hsCRP, homocysteine, ferritin, fasting insulin, and vitamin D are among the most actionable markers — and among the most commonly overlooked in brief primary care appointments.
- Personalized supplementation starts with real data. Platforms like Ones are designed to translate your specific lab numbers into a formula that addresses your actual gaps, not a population average.
- Always consult a qualified healthcare provider for interpretation of abnormal results and before making significant changes to medications or supplementation protocols.