Lifestyle
What Does Fasting Glucose Actually Measure?: What the Sleep, Stress, and Longevity Literature Suggests
Your fasting glucose result isn't just a diabetes screening number—it's a window into your sleep quality, stress hormone patterns, and long-term cellular aging. Yet most standard lab reports treat it as a simple pass/fail, leaving critical metabolic context on the table. Here's what the research actually says about what fasting glucose measures, and why the story doesn't end at 99 mg/dL.
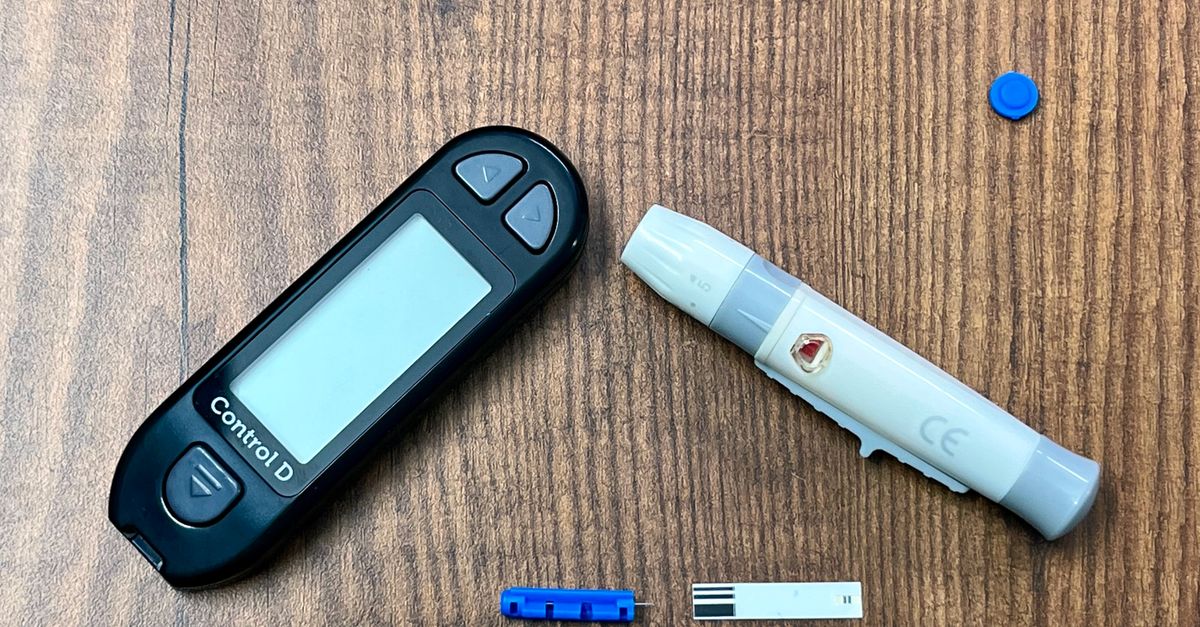
What Does Fasting Glucose Actually Measure?
When your doctor orders a fasting glucose test, the instruction is simple: don't eat for at least eight hours, then give blood. The number that comes back—expressed in milligrams per deciliter (mg/dL)—is typically framed as a diabetes risk screen. Under 100 mg/dL is "normal," 100–125 is "prediabetes," 126 and above is "diabetes." Case closed, right?
Not quite. Fasting glucose is measuring something far more dynamic than a static snapshot of your sugar intake. It reflects hepatic glucose output overnight, the sensitivity of your cells to insulin signaling, the influence of cortisol's early-morning surge, the quality of your previous night's sleep, and even your biological aging trajectory. Understanding those layers is the difference between a number that sits in a file and information you can actually act on.
The Liver Is Doing Most of the Work Overnight
During a fast, your muscles and brain still demand glucose. The liver obligingly releases stored glycogen and manufactures new glucose through gluconeogenesis—a process tightly regulated by insulin and glucagon. Fasting glucose, therefore, is primarily a readout of hepatic glucose output, not dietary carbohydrate from the night before.
When fasting glucose creeps above 90 mg/dL—still technically "normal"—it often signals that the liver is becoming less responsive to insulin's suppressive signal. A landmark analysis published in Diabetes Care found that individuals with fasting glucose in the 95–99 mg/dL range had significantly higher rates of progression to type 2 diabetes over a decade compared to those below 90, even though both groups were categorized as "normal" (Tirosh et al., Diabetes Care 2008; PMID: 18596059). The conventional cutoff misses meaningful early metabolic drift.
Sleep Quality Moves Your Fasting Glucose More Than Most People Realize
One of the most underappreciated drivers of fasting glucose is what happened in your bedroom the night before. Sleep restriction—even a single night of less than six hours—measurably elevates morning glucose by impairing insulin sensitivity and amplifying the cortisol awakening response.
A rigorous crossover trial published in Annals of Internal Medicine demonstrated that just four nights of sleep restriction (to 4.5 hours) reduced insulin sensitivity by about 25% in healthy young adults (Spiegel et al., Annals of Internal Medicine 2015; PMID: 26122048). Importantly, participants' fasting glucose didn't spike dramatically—instead, the pancreas compensated by secreting more insulin. That compensation masks worsening insulin resistance when you look at glucose alone, which is exactly why fasting insulin changes the story.
What Does Fasting Insulin Actually Measure?
Fasting insulin is the companion biomarker that transforms fasting glucose from a noun into a verb. While glucose tells you where concentrations sit, insulin tells you how hard the pancreas is working to hold them there.
A fasting insulin above 8–10 µIU/mL in the presence of a "normal" fasting glucose is a classic early signature of insulin resistance. The HOMA-IR formula (fasting glucose mg/dL × fasting insulin µIU/mL ÷ 405) quantifies this relationship. A HOMA-IR above 1.9 is associated with meaningful insulin resistance in most research populations; above 2.9 suggests significant resistance.
Research published in Circulation established that elevated fasting insulin independently predicts cardiovascular events even after adjusting for traditional lipid risk factors—a finding that underscores how much metabolic information is lost when insulin is not included in routine panels (Després et al., Circulation 1996; PMID: 8598068). If your lab only ordered glucose, you may be seeing the tip of the metabolic iceberg.
From a longevity standpoint, chronically elevated insulin accelerates mTOR signaling, suppresses autophagy, and drives cellular senescence—mechanisms directly relevant to biological aging. The insulin-glucose pair, therefore, is one of the most information-dense combinations available on a standard metabolic panel.
Cortisol, the Dawn Phenomenon, and Morning Glucose Spikes
Between roughly 4 and 8 a.m., cortisol rises sharply in what physiologists call the cortisol awakening response. This is adaptive: cortisol mobilizes glucose to prepare the body for waking activity. But in chronically stressed individuals—or those with dysregulated HPA axis function—this surge can be exaggerated, pushing fasting glucose higher not because of insulin resistance, but because of adrenal hormone activity.
This is why two people with identical diets and body compositions can have meaningfully different fasting glucose values based on their current stress load and adrenal function. When fasting glucose is borderline elevated and the patient reports high psychological stress or disrupted sleep, adrenal support becomes part of the metabolic conversation—not just dietary intervention.
Adaptogens like Rhodiola Rosea and ashwagandha have demonstrated HPA-axis modulating effects in controlled trials. Ones includes KSM-66 ashwagandha at 600 mg—the dose used in the Chandrasekhar et al. Indian Journal of Psychological Medicine trial that showed significant reductions in serum cortisol (Chandrasekhar et al., IJPM 2012; PMID: 23439798)—and Rhodiola Rosea extract in formulas where adrenal dysregulation is flagged as a contributing factor. These aren't glucose-lowering supplements; they address an upstream hormonal driver of elevated fasting glucose that blood sugar drugs don't touch.
Fasting Glucose as a Longevity Biomarker
Beyond diabetes risk, the longevity medicine community has reframed fasting glucose as one of the most actionable predictors of healthspan. Analysis of the Baltimore Longitudinal Study of Aging found that fasting glucose in the low-normal range (70–85 mg/dL) was associated with longer telomere length and reduced all-cause mortality compared to the upper end of the "normal" range (NIH National Institute on Aging data; referenced in López-Otín et al., Cell 2013; doi.org/10.1016/j.cell.2013.05.039).
The mechanism involves advanced glycation end-products (AGEs)—proteins and lipids that become permanently modified by excess glucose over time. AGEs accumulate in collagen, arterial walls, and the lens of the eye, contributing to stiffness, atherosclerosis, and retinal damage. This process begins well below the diabetes threshold, which is why functional medicine practitioners increasingly target fasting glucose below 90 mg/dL rather than below 100.
What Does Thyroid Antibodies Actually Measure?
Thyroid antibodies—specifically TPO antibodies (anti-thyroid peroxidase) and TG antibodies (anti-thyroglobulin)—measure immune system activity directed against thyroid tissue. They are the primary diagnostic markers for Hashimoto's thyroiditis, the most common cause of hypothyroidism in the developed world.
Importantly, thyroid antibodies often become elevated years before TSH or thyroid hormone levels shift outside the conventional reference range. A person can have high TPO antibodies, a TSH of 2.8 mIU/L, a free T4 in the middle of the reference range, and still experience fatigue, brain fog, cold intolerance, and weight gain—because subclinical autoimmune inflammation is ongoing even when standard markers appear normal.
Elevated thyroid antibodies are also directly relevant to metabolic health. Autoimmune thyroid disease is associated with insulin resistance and dyslipidemia independent of overt hypothyroidism (Peppa et al., Journal of Diabetes Research 2011; doi.org/10.1155/2011/895468). When fasting glucose is mildly elevated alongside borderline TSH and positive thyroid antibodies, the clinical picture becomes more coherent: thyroid-mediated metabolic slowing is contributing to glucose dysregulation.
What Does Free T4 Actually Measure?
Free T4 (thyroxine) is the circulating, unbound thyroid hormone produced directly by the thyroid gland. It is the storage form of thyroid hormone—metabolically inactive until converted to free T3 in peripheral tissues, primarily the liver and kidneys.
Free T4 tells you how much hormone the thyroid is producing, but it does not tell you whether that hormone is being effectively converted at the cellular level. A person with low-normal free T4 (say, 0.9 ng/dL in a range of 0.8–1.8) may technically be "in range" but have inadequate substrate for conversion, particularly under conditions of caloric restriction, chronic inflammation, or elevated cortisol—all of which suppress the deiodinase enzymes responsible for T4-to-T3 conversion.
What Does Free T3 Actually Measure?
Free T3 (triiodothyronine) is the biologically active thyroid hormone that actually enters cells and binds to nuclear receptors. It regulates basal metabolic rate, mitochondrial function, glucose uptake in muscle, and cholesterol clearance. A normal free T4 with a low-normal free T3 is the classic pattern of "conversion impairment"—and it explains why some people have textbook TSH and T4 values but still feel hypothyroid.
From a metabolic standpoint, low free T3 slows glucose clearance and reduces the efficiency of mitochondrial energy production. This creates a direct intersection between thyroid function and fasting glucose: when free T3 is suboptimal, cells become less metabolically active, hepatic glucose output is less effectively suppressed, and fasting glucose drifts upward even in the absence of classic insulin resistance.
Selenium is a critical cofactor for the deiodinase enzymes that convert T4 to T3. The Gärtner et al. trial in Journal of Clinical Endocrinology & Metabolism demonstrated that 200 mcg/day of selenomethionine significantly reduced TPO antibody titers in Hashimoto's patients over three months (Gärtner et al., JCEM 2002; PMID: 11932302)—making selenium one of the few nutrients with direct clinical evidence in thyroid autoimmunity.
What This Means for Your Formula
When Ones analyzes your lab data, fasting glucose doesn't live in isolation. It is interpreted alongside fasting insulin, HOMA-IR, thyroid panel values, and—where wearable data is available—sleep quality metrics and HRV trends.
If your fasting glucose is elevated in the context of elevated cortisol markers or disrupted sleep, Ones may include KSM-66 ashwagandha at 600 mg and Rhodiola Rosea to address HPA-axis dysregulation as an upstream driver—rather than assuming the problem is purely dietary.
If the pattern suggests thyroid-related metabolic slowing, Ones' Thyroid Support blend incorporates selenium (as selenomethionine) alongside iodine, zinc, and additional cofactors at doses calibrated to clinical evidence—not arbitrary proprietary blends. The goal is to support T4-to-T3 conversion and reduce the autoimmune inflammation that can silently impair metabolic function years before a conventional diagnosis.
For users whose metabolic data points to mitochondrial inefficiency or oxidative stress driving elevated glucose, CoQ10 as Ubiquinol at 200 mg supports cellular energy production and has demonstrated improvements in insulin sensitivity in controlled trials.
Every Ones formula is built from your specific lab findings—not a generic "metabolic health" template. The AI health practitioner selects your daily capsule plan (either a 6- or 9-capsule configuration) based on the complexity and number of findings identified, so the formula scales to your actual clinical picture.
If you're navigating questions about blood sugar, thyroid function, or sleep-related metabolic disruption, consulting with a qualified healthcare provider alongside personalized lab analysis is always recommended. Ones is designed to complement that clinical relationship with precision supplementation—not replace medical care.
For a deeper look at how thyroid and metabolic markers interact, explore our guide to thyroid support supplements and conversion or learn more about how fasting insulin differs from fasting glucose.
Understanding how your adrenal hormones shape your metabolic panel is also covered in our article on cortisol's role in blood sugar regulation.
Key Takeaways
- Fasting glucose primarily reflects hepatic glucose output overnight—not last night's dinner—and is modulated by insulin sensitivity, cortisol levels, and sleep quality.
- A fasting glucose in the 90–99 mg/dL range is statistically "normal" but is associated with meaningfully higher diabetes progression risk compared to values below 90 mg/dL.
- Fasting insulin is the essential companion biomarker: it reveals how hard the pancreas is compensating, and HOMA-IR captures insulin resistance that normal glucose values alone will miss.
- Sleep restriction as brief as four nights significantly impairs insulin sensitivity—making your fasting glucose a readout of sleep health as much as dietary behavior.
- Thyroid antibodies, free T4, and free T3 are directly connected to metabolic rate and glucose clearance; low free T3 or autoimmune thyroid activity can elevate fasting glucose independently of insulin resistance.
- Selenium (200 mcg as selenomethionine), adaptogenic herbs like KSM-66 ashwagandha, and mitochondrial support with Ubiquinol CoQ10 each address distinct upstream mechanisms that influence what your fasting glucose number is actually telling you.