Lab Results
Understanding Blood Test Results Explained on Your Lab Report
Most people glance at a lab report, see a row of numbers flagged 'normal,' and file it away — but normal isn't the same as optimal. Understanding what your blood test results actually mean can reveal nutritional deficiencies, metabolic stress, and inflammation months or years before symptoms appear. This guide breaks down the most clinically significant markers on a standard lab report and shows you how to use that data to drive smarter supplement decisions.
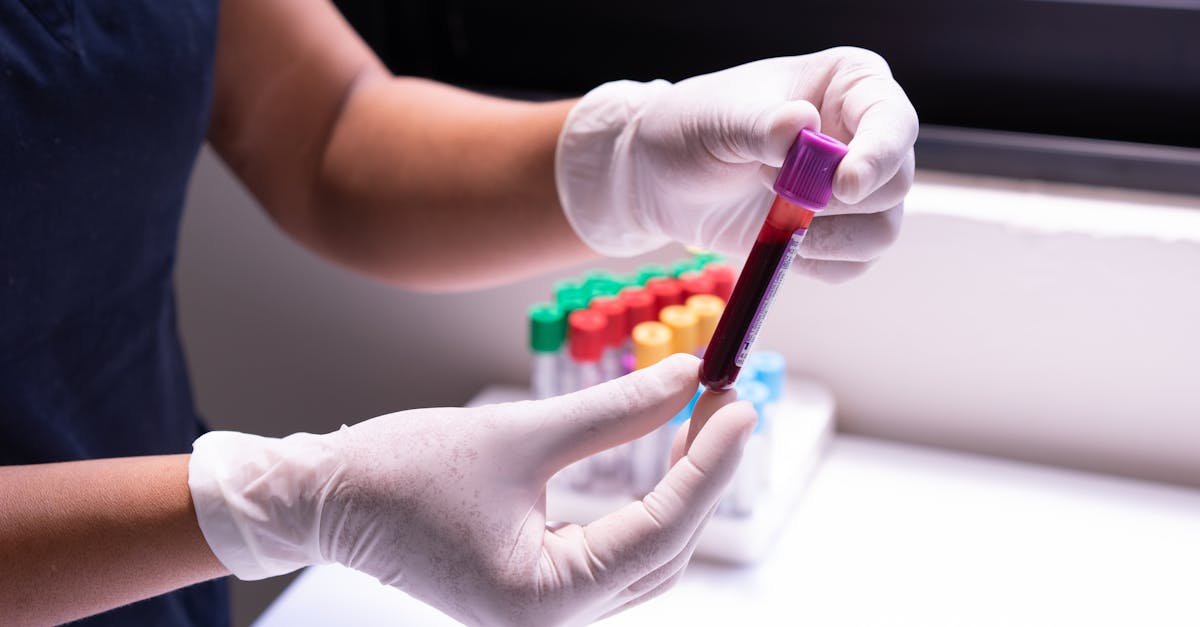
Understanding Blood Test Results Explained on Your Lab Report
Your annual bloodwork is one of the most data-rich windows into your health — yet most people leave the doctor's office with little more than a vague reassurance that everything looks 'fine.' The problem is that standard laboratory reference ranges are built on population averages, not on what a specific body needs to function at its best. A result sitting at the low end of 'normal' can still indicate a meaningful deficiency. A marker trending in the wrong direction over two years can signal early metabolic dysfunction — even if no single value has crossed a threshold.
Learning to read your own lab report is not about playing doctor. It is about becoming a more informed participant in your own care, asking better questions, and making more targeted decisions about nutrition, lifestyle, and supplementation. This article walks you through the most important panels on a standard blood test, explains what each marker measures, and clarifies the difference between laboratory 'normal' and functional optimal ranges.
---
What Does a Standard Blood Panel Actually Measure?
Most routine blood panels ordered by a primary care physician fall into a handful of categories. Understanding these categories gives you a framework for reading any lab report.
Complete Blood Count (CBC)
The CBC measures the cellular components of your blood. Key markers include:
| Marker | What It Measures | Functional Optimal Range |
|---|---|---|
| Hemoglobin | Oxygen-carrying capacity | Men: 14–17.5 g/dL; Women: 13–15.5 g/dL |
| Hematocrit | Proportion of red blood cells | Men: 41–53%; Women: 36–46% |
| MCV (Mean Corpuscular Volume) | Red blood cell size | 82–92 fL |
| WBC (White Blood Cell Count) | Immune cell activity | 4.5–7.5 K/µL |
| Platelets | Clotting function | 150–350 K/µL |
| Ferritin (often separate) | Iron storage | Men: 70–150 ng/mL; Women: 50–120 ng/mL |
A low MCV alongside low ferritin strongly suggests iron-deficiency anemia or pre-anemia, even if hemoglobin is technically within the normal range. Research has shown that ferritin below 30 ng/mL is associated with fatigue and cognitive impairment in women of reproductive age, even in the absence of overt anemia (Verdon et al., BMJ 2003; PMID: 12543835).
Comprehensive Metabolic Panel (CMP)
The CMP covers kidney function, liver function, blood sugar, and electrolytes. This is where metabolic health trends become visible years before a diagnosis.
| Marker | Optimal Range | Why It Matters |
|---|---|---|
| Fasting Glucose | 70–85 mg/dL | Below 100 is 'normal'; below 85 is optimal for insulin sensitivity |
| HbA1c | < 5.4% | Reflects 3-month average blood sugar; pre-diabetes starts at 5.7% |
| ALT / AST (liver enzymes) | < 25 U/L (ALT) | Elevations signal hepatic stress |
| Creatinine | 0.8–1.1 mg/dL | Kidney filtration marker |
| BUN (Blood Urea Nitrogen) | 10–18 mg/dL | Protein metabolism and hydration |
| Sodium / Potassium | Na: 136–142; K: 3.8–4.5 | Adrenal and cardiovascular function |
Fasting glucose in the 90–99 mg/dL range is technically 'normal' but represents significantly elevated insulin resistance risk compared to values in the 70–85 mg/dL range. A large prospective study found that fasting glucose above 87 mg/dL predicted type 2 diabetes development over a 22-year follow-up, well below the clinical pre-diabetes threshold (Tirosh et al., NEJM 2005; PMID: 15829534).
---
How to Read Reference Ranges vs. Optimal Ranges
This is perhaps the most important concept in understanding your lab report. Laboratory reference ranges are calculated statistically — they typically represent the middle 95% of a tested population. That means 5% of healthy people will fall outside the range, and it also means that a population with widespread nutritional deficiency will produce a reference range that normalizes deficiency.
Vitamin D is the clearest example. The conventional lower limit of 'normal' for 25-hydroxyvitamin D is often set at 20 ng/mL. However, research on immune function, bone density, and mood consistently identifies optimal function beginning at 40–60 ng/mL (Holick et al., Journal of Clinical Endocrinology & Metabolism 2011; PMID: 21646368). A reading of 22 ng/mL would pass a standard lab flag — but it would represent a meaningful functional shortfall.
The same gap between 'normal' and 'optimal' applies to:
- Magnesium: Serum magnesium is a poor proxy for total body magnesium status; the lower end of the normal range (1.7 mg/dL) can coexist with significant intracellular deficiency. Erythrocyte (RBC) magnesium is a more sensitive measure.
- Thyroid (TSH): Standard reference ranges run as wide as 0.5–4.5 mIU/L. Functional practitioners typically target 1.0–2.5 mIU/L for optimal energy and metabolic function.
- Testosterone (Total): A 35-year-old man at 280 ng/dL is 'normal' by lab standards but may be in the bottom quartile for his age group and experiencing low energy, poor recovery, and mood changes.
If you want to understand how correcting suboptimal vitamin D levels can translate into tangible health improvements, the clinical evidence on vitamin D3 and K2 synergy is a useful companion read.
---
Key Nutrient and Hormone Biomarkers Worth Testing
Beyond the standard panels, several additional markers provide high-value information about nutritional status and hormonal health. Ask your physician to include these if they are not already on your order.
Lipid Panel (with Advanced Markers)
Standard lipid panels report total cholesterol, LDL, HDL, and triglycerides. More informative expanded panels also include:
- Apolipoprotein B (ApoB): A stronger predictor of cardiovascular risk than LDL-C alone. ApoB counts every atherogenic particle. Optimal is below 80 mg/dL for average-risk individuals (Sniderman et al., JAMA Internal Medicine 2019; doi.org/10.1001/jamainternmed.2019.2715).
- Lp(a): A genetically determined lipoprotein that standard LDL calculations miss entirely. Elevated Lp(a) is an independent cardiovascular risk factor.
- Triglyceride/HDL ratio: A ratio below 2.0 is associated with better insulin sensitivity and lower small-dense LDL particle count.
Inflammatory Markers
- hsCRP (High-Sensitivity C-Reactive Protein): A marker of systemic inflammation. Optimal is below 1.0 mg/L. Values above 3.0 mg/L double cardiovascular risk independent of cholesterol levels (Ridker et al., NEJM 2002; PMID: 11794149).
- Homocysteine: Elevated homocysteine (above 10 µmol/L) is associated with cardiovascular disease and cognitive decline and often reflects B12, folate, or B6 insufficiency.
Hormonal Markers
- Cortisol (morning serum): Optimal morning cortisol is 15–25 µg/dL. Consistently low values may reflect adrenal fatigue patterns; chronically elevated values are associated with insulin resistance and immune suppression.
- Free T3 / Free T4: More sensitive thyroid markers than TSH alone. Low-normal Free T3 alongside a borderline TSH can explain unexplained fatigue, cold intolerance, and weight resistance.
- DHEA-S: A steroid hormone precursor that declines with age and chronic stress. Low DHEA-S often accompanies elevated cortisol.
For a deeper dive into how blood glucose and insulin sensitivity markers interact, the optimal magnesium glycinate dosage for metabolic support article covers the role magnesium plays in glucose transport and insulin signaling.
---
Connecting Wearable Data and Lab Results
Lab results tell you what is happening inside your body at a single point in time. Wearable data — heart rate variability (HRV), resting heart rate, sleep staging, and activity load — shows you how your body responds to daily stressors in real time. Used together, these two data streams are more actionable than either source alone.
For example:
- Low HRV + high hsCRP + low magnesium: This triad suggests a nervous system under inflammatory stress. Magnesium plays a direct role in HRV regulation; a randomized controlled trial found that magnesium supplementation improved HRV parameters in healthy adults over an 8-week period (Wienecke & Nolden, MMW Fortschritte der Medizin 2016; PMID: 27869100).
- Poor sleep staging + low ferritin + low cortisol: This combination points toward adrenal-fatigue and iron deficiency contributing to disrupted sleep architecture.
- High resting heart rate + low vitamin D + low omega-3 index: Omega-3 fatty acids have demonstrated the ability to lower resting heart rate and reduce cardiovascular risk markers. The ASCEND and REDUCE-IT trials established that high-dose EPA/DHA supplementation meaningfully reduces cardiovascular event rates (Bhatt et al., NEJM 2019; PMID: 30415628).
Platforms that integrate both wearable data streams and lab results into a single interpretation layer are rare. This is where AI-driven tools that analyze multiple inputs simultaneously offer a meaningful advantage over reviewing either source in isolation.
---
What Optimal Lab Ranges Look Like Across Age Groups
Reference ranges are also not age-stratified in the way that optimal ranges should be. A TSH of 2.8 mIU/L looks the same to a standard lab report whether the patient is 28 or 68 — but the clinical interpretation differs significantly. Similarly, testosterone reference ranges in men span 300–1000 ng/dL regardless of age, even though studies demonstrate that values appropriate for a 70-year-old may be associated with metabolic dysfunction in a 40-year-old.
When tracking your labs over time, look for trends rather than isolated values. A fasting glucose that moves from 78 to 84 to 91 mg/dL across three consecutive annual panels is technically 'normal' at each time point — but the trend is a meaningful signal worth addressing proactively through nutrition, exercise, and targeted supplementation.
If your labs show patterns consistent with thyroid or adrenal stress, understanding the role of adaptogens in your supplement protocol is worth exploring. The clinical evidence for ashwagandha for cortisol and stress covers the mechanistic basis and optimal dosing for adrenal support.
---
What This Means for Your Formula
The real value of understanding your blood test results is that it transforms supplement decisions from guesswork into targeted, evidence-based interventions. Here is how Ones directly applies lab data to personalized formulas:
Vitamin D3 + K2 (MK-7): When your 25-hydroxyvitamin D comes back below 40 ng/mL, Ones includes D3 at clinically relevant doses paired with K2 as MK-7 — the form shown to direct calcium into bones rather than arterial walls. This pairing is essential because vitamin D repletion without K2 can elevate uncarboxylated matrix Gla-protein, a marker of arterial calcification risk (Knapen et al., Osteoporosis International 2013; PMID: 23525894).
Magnesium Glycinate (as part of Ones' Magnesium Complex): Low RBC magnesium or indirect indicators like muscle cramping, poor sleep, and elevated blood pressure on your CMP trend data prompt inclusion of Ones' Magnesium Complex — formulated with glycinate for superior absorption and minimal gastrointestinal side effects compared to oxide forms. Magnesium glycinate has been shown to improve sleep efficiency and reduce cortisol-driven nighttime arousal (Abbasi et al., Journal of Research in Medical Sciences 2012; PMID: 23853635).
Omega-3 (EPA/DHA): When triglycerides are elevated, HDL is suppressed, or hsCRP signals chronic inflammation, Ones formulas incorporate EPA/DHA at doses aligned with clinical outcomes — not the token amounts found in mass-market multivitamins. The omega-3 EPA DHA ratio guide explains why the ratio between EPA and DHA matters for different health targets, from cardiovascular protection to mood support.
Ashwagandha KSM-66 (600mg): When morning cortisol is elevated, DHEA-S is suppressed, or wearable data shows chronically low HRV alongside high stress load, Ones may include KSM-66 ashwagandha at the 600mg dose used in the landmark Chandrasekhar et al. randomized controlled trial, which demonstrated a 27.9% reduction in serum cortisol over 60 days (Chandrasekhar et al., Indian Journal of Psychological Medicine 2012; PMID: 23439798).
CoQ10/Ubiquinol (200mg): When statin use is flagged in health history or CoQ10-depleting medications are in play — or when Ones' AI identifies cardiovascular risk indicators across lab and wearable data — ubiquinol at 200mg is included. Ubiquinol is the reduced, bioavailable form of CoQ10, and studies demonstrate meaningfully higher plasma absorption compared to ubiquinone (Langsjoen & Langsjoen, Biofactors 2014; PMID: 25098911).
Ones operates as an AI health practitioner that cross-references your bloodwork, wearable metrics, and health history against its catalog of over 70 clinically validated ingredients. Rather than a generic formula, your capsule plan — available in 6, 9, or 12-capsule configurations — is calibrated to close the specific gaps your labs reveal.
---
Key Takeaways
- 'Normal' is not the same as 'optimal.' Laboratory reference ranges are statistical population averages, not targets for peak function. Vitamin D, ferritin, fasting glucose, and TSH all have meaningful gaps between the lower bound of 'normal' and levels associated with optimal health.
- Context transforms numbers. A single marker rarely tells the whole story. Low HRV on a wearable combined with elevated hsCRP and low magnesium tells a richer clinical story than any one value alone.
- Trends matter as much as thresholds. Tracking markers year-over-year is often more informative than a single snapshot — especially for fasting glucose, lipids, and thyroid function.
- Key markers beyond the standard panel include ApoB, Lp(a), hsCRP, homocysteine, ferritin, and Free T3/T4 — ask your physician to include these for a more complete picture.
- Supplement decisions should follow lab evidence. Pairing D3 with K2-MK7, correcting magnesium deficiency with glycinate, and matching omega-3 dose to cardiovascular risk markers are all evidence-based choices that start with reading your labs correctly.
- Personalized formulas built from actual biomarker data — as Ones provides — close nutritional gaps more precisely than population-average multivitamins, and at clinically meaningful doses backed by peer-reviewed research.