Lab Results
Complete Blood Count (CBC): What Every Marker Means and the Optimal Ranges
Most people glance at their CBC results, see 'normal' printed next to every value, and assume everything is fine — but standard lab reference ranges are built for disease detection, not peak health. Understanding what your complete blood count actually reveals about energy, immunity, inflammation, and nutrient status can change how you approach supplementation entirely.
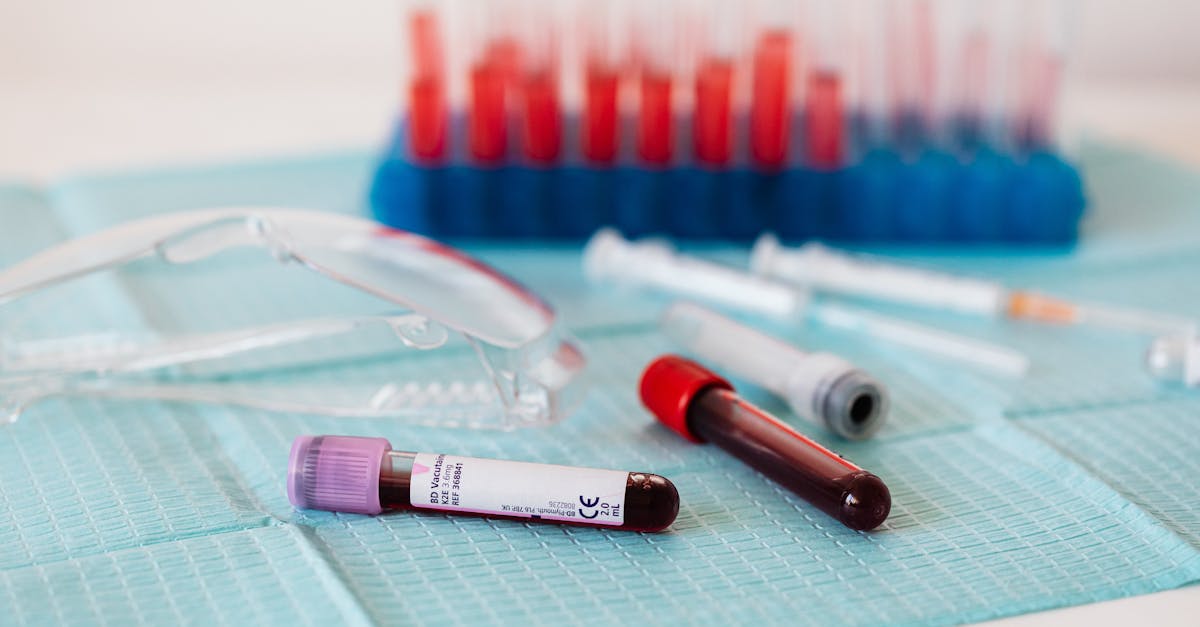
Complete Blood Count (CBC): What Every Marker Means and the Optimal Ranges
A complete blood count is one of the most ordered lab tests in medicine — and one of the most underused tools for proactive health optimization. Ordered at nearly every annual physical, the CBC gives clinicians a snapshot of red blood cells, white blood cells, platelets, and the proteins and ratios that connect them. Yet most people receive their results with nothing more than a 'looks normal' from a rushed provider.
The problem is that 'normal' and 'optimal' are not the same thing. Standard reference ranges are derived from population-wide data and designed to flag pathology. Functional and integrative practitioners have long recognized that many people feel their worst while sitting squarely inside those ranges. Learning to read a CBC through an optimization lens — not just a disease-detection lens — is one of the most actionable things you can do for your long-term health.
This guide walks through every major CBC marker, explains what it measures physiologically, gives you both the standard and functionally optimal ranges, and explains what deviations might signal nutritionally.
---
CBC Blood Test Markers: A Full Panel Breakdown
A standard CBC includes two broad categories: the red cell panel and the white cell panel. Most labs also report platelets. Here is every marker you are likely to see.
Red Blood Cell Panel
| Marker | Abbreviation | Standard Range | Functional Optimal Range |
|---|---|---|---|
| Red Blood Cell Count | RBC | M: 4.5–5.9 M/µL; F: 4.0–5.2 M/µL | M: 4.7–5.5; F: 4.2–5.0 |
| Hemoglobin | Hgb | M: 13.5–17.5 g/dL; F: 12.0–15.5 g/dL | M: 14.5–16.0; F: 13.0–14.5 |
| Hematocrit | Hct | M: 41–53%; F: 36–46% | M: 43–49%; F: 38–44% |
| Mean Corpuscular Volume | MCV | 80–100 fL | 85–95 fL |
| Mean Corpuscular Hemoglobin | MCH | 27–33 pg | 28–32 pg |
| MCHC | MCHC | 32–36 g/dL | 33–35 g/dL |
| Red Cell Distribution Width | RDW | 11.5–14.5% | 11.5–13.0% |
White Blood Cell Panel
| Marker | Standard Range | Functional Optimal Range |
|---|---|---|
| Total WBC | 4.0–11.0 K/µL | 5.0–8.0 K/µL |
| Neutrophils | 50–70% | 50–65% |
| Lymphocytes | 20–40% | 25–40% |
| Monocytes | 2–8% | 2–6% |
| Eosinophils | 1–4% | <3% |
| Basophils | 0–1% | <1% |
Platelet Panel
| Marker | Standard Range | Functional Optimal Range |
|---|---|---|
| Platelet Count | 150–400 K/µL | 175–350 K/µL |
| Mean Platelet Volume (MPV) | 7.5–12.5 fL | 8.0–11.0 fL |
---
Hemoglobin Optimal Range: More Than Just Anemia Detection
Hemoglobin is the iron-containing protein inside red blood cells responsible for oxygen transport. Most labs flag low hemoglobin only when it dips below 12.0 g/dL in women or 13.5 g/dL in men — thresholds that indicate clinical anemia. But research consistently shows that symptoms like fatigue, reduced exercise capacity, and cognitive sluggishness can appear well before those cutoffs are breached.
A 2012 analysis published in the American Journal of Epidemiology found that hemoglobin values in the lower quartile of the 'normal' range were independently associated with reduced physical performance in older adults (doi.org/10.1093/aje/kwr325). Functionally, many practitioners aim for hemoglobin values in the 14.5–16.0 g/dL range for men and 13.0–14.5 g/dL for women as a more energizing target.
Low hemoglobin production depends on adequate iron (specifically ferritin stores), vitamin B12, folate, and vitamin B6. If your hemoglobin sits at the lower end of normal, a follow-up ferritin and B12 panel is warranted before assuming the issue is dietary iron alone. Elevated hemoglobin can indicate dehydration, sleep apnea-driven hypoxia, or — rarely — polycythemia vera, and also warrants investigation.
Nutrients that directly support hemoglobin synthesis:
- Iron (as ferrous bisglycinate or heme iron)
- Vitamin B12 (methylcobalamin)
- Folate (5-MTHF, especially in MTHFR variants)
- Vitamin B6 (pyridoxal-5-phosphate)
- Copper (cofactor in iron metabolism)
If you're tracking your ferritin alongside your CBC, understanding the connection between ferritin and energy levels can help you set a more meaningful target beyond the standard anemia cutoff.
---
Hematocrit Optimal Range: Oxygen Delivery and Athletic Performance
Hematocrit measures the percentage of blood volume occupied by red blood cells. It rises and falls in close parallel with hemoglobin, so the two are usually interpreted together. A low hematocrit often points toward nutritional deficiencies (iron, B12, folate) or chronic inflammation suppressing erythropoiesis. A high hematocrit above 52% in men or 47% in women may suggest dehydration, high-altitude adaptation, or conditions that increase erythropoietin (EPO) production.
From a performance standpoint, hematocrit is closely watched by endurance athletes because it directly reflects the blood's oxygen-carrying capacity. Research in Sports Medicine has consistently noted that even modest decreases in hematocrit within the normal range can reduce VO2 max and time-to-exhaustion (Lundby & Robach, Scandinavian Journal of Medicine & Science in Sports, 2015; doi.org/10.1111/sms.12513).
The functionally optimal hematocrit range — 43–49% for men and 38–44% for women — represents a zone where oxygen delivery is efficient without the viscosity-related cardiovascular risk that comes with very elevated values.
---
Understanding MCV and RDW: The Shape and Uniformity of Your Red Cells
Two markers that are routinely overlooked carry significant nutritional information: MCV (mean corpuscular volume) and RDW (red cell distribution width).
MCV tells you the average size of your red blood cells:
- Low MCV (<80 fL): Microcytic anemia — classic sign of iron deficiency or thalassemia trait
- Normal MCV (80–100 fL): Normocytic — may still reflect early deficiency, chronic disease anemia, or be completely healthy
- High MCV (>100 fL): Macrocytic — signals B12 or folate deficiency, or excess alcohol intake
RDW tells you how variable your red blood cells are in size. A high RDW (>14.5%) means your bone marrow is churning out cells of inconsistent sizes — a pattern seen in mixed nutritional deficiencies (iron + B12 simultaneously), early iron deficiency before MCV drops, and as an emerging inflammatory marker. A large meta-analysis in PLOS ONE found elevated RDW independently predicted all-cause mortality in the general population, even after adjusting for known risk factors (Patel et al., 2009; PMID: 19997538). More recent work confirms its utility as an inflammation surrogate (NIH ODS acknowledges RDW as a non-specific marker of hematologic stress).
---
White Blood Cell Count Normal Range: Reading Immune Status, Not Just Infection
The white blood cell (WBC) count and its differential — the breakdown into neutrophils, lymphocytes, monocytes, eosinophils, and basophils — tell a story about your immune system's baseline state that goes well beyond detecting acute infection.
Total WBC: A total WBC persistently above 8.0 K/µL in the absence of infection or recent vaccination may reflect chronic low-grade inflammation, metabolic stress, or unresolved immune activation. A 2019 study in Scientific Reports found that WBC in the upper-normal range (8.0–11.0 K/µL) was independently associated with increased cardiovascular event risk over a 10-year follow-up (doi.org/10.1038/s41598-019-42570-3). Conversely, a WBC below 4.0 K/µL (leukopenia) may signal nutritional deficiency, viral suppression, or autoimmune activity.
Neutrophil-to-Lymphocyte Ratio (NLR): Divide your absolute neutrophil count by your absolute lymphocyte count. An NLR above 2.5 is increasingly used as a systemic inflammation marker. Research published in JAMA Oncology and several cardiovascular journals identifies elevated NLR as predictive of poor outcomes across multiple chronic conditions (Forget et al., BioMed Research International, 2017; doi.org/10.1155/2017/8634978).
Eosinophils: Even within the normal range, eosinophils above 3% can suggest subclinical allergic load, histamine reactivity, or parasitic exposure. If your eosinophils are consistently above 2.5%, it is worth exploring histamine intolerance and its connection to immune dysregulation alongside your CBC patterns.
What moves WBC in the right direction nutritionally:
- Zinc: Essential for lymphocyte proliferation and innate immune function. A Cochrane-adjacent meta-analysis by Hemilä (2011) confirmed zinc's role in reducing immune duration markers (PMID: 21328251).
- Vitamin D3: Receptors on virtually every immune cell type. Deficiency correlates with elevated inflammatory markers across population studies (NIH ODS, Vitamin D Fact Sheet for Health Professionals).
- Omega-3 fatty acids (EPA/DHA): Shown to reduce neutrophil-driven inflammation by competing with arachidonic acid pathways (Calder, Annals of Nutrition and Metabolism, 2019; doi.org/10.1159/000501239).
- NAC (N-Acetyl Cysteine): Precursor to glutathione, supporting oxidative balance within immune cells.
For a deeper look at how EPA and DHA modulate inflammatory signaling, the omega-3 EPA/DHA ratio guide walks through the clinical evidence and dosing considerations.
---
Platelet Markers: MPV and What It Signals
Platelet count is routinely checked but mean platelet volume (MPV) is rarely discussed with patients. MPV reflects platelet size — larger platelets are metabolically more active and release more pro-clotting and pro-inflammatory mediators. An MPV above 11.0 fL in the context of cardiovascular risk has been associated with increased thrombotic events in multiple observational studies (Slavka et al., Arteriosclerosis, Thrombosis, and Vascular Biology, 2011; doi.org/10.1161/ATVBAHA.110.221788).
Nutrients that support healthy platelet function include magnesium (which reduces platelet aggregation), omega-3s (which reduce thromboxane A2 production), and CoQ10 (which supports mitochondrial health in highly metabolic platelets).
---
What This Means for Your Formula: How Ones Addresses CBC-Driven Nutrient Gaps
A CBC is a window into your nutritional status — but acting on what it shows requires precision dosing of the right ingredients. Ones uses your blood work alongside wearable data and health history to build a custom capsule formula calibrated to your specific gaps, not a one-size-fits-all multi.
Here are three areas where Ones' formulations directly address common CBC findings:
1. Omega-3 (EPA/DHA) for WBC Optimization
Ones includes pharmaceutical-grade Omega-3 at clinically meaningful EPA and DHA doses. A 2019 review in Annals of Nutrition and Metabolism confirmed EPA/DHA's role in shifting immune cells away from pro-inflammatory phenotypes (doi.org/10.1159/000501239). If your NLR or monocyte percentage trends high, omega-3 is one of the most evidence-backed interventions available.
2. Magnesium Glycinate and Magnesium Complex for Red Cell and Platelet Health
Magnesium is a cofactor in over 300 enzymatic reactions, including several involved in red blood cell membrane stability and platelet aggregation inhibition. Ones offers both individual Magnesium Glycinate and a proprietary Magnesium Complex System Blend. The optimal magnesium glycinate dosage for most adults ranges from 200–400 mg elemental magnesium, a range Ones calibrates based on your dietary intake and lab data.
3. Vitamin D3 + K2 (MK-7) for Immune Cell Function
Ones pairs D3 with K2 as MK-7, the form with the longest half-life and the best evidence for supporting calcium metabolism and vascular health simultaneously. For immune support reflected in your WBC differential, vitamin D3 at doses reaching 25-hydroxyvitamin D serum levels of 40–60 ng/mL is the evidence-supported target (Endocrine Society Clinical Practice Guidelines; doi.org/10.1210/jc.2011-2385). Ones adjusts D3 dosing based on your actual 25-OH vitamin D lab value — not a population average. The vitamin D3 and K2 synergy article covers this pairing in full clinical detail.
If your CBC reveals patterns like elevated RDW, low-normal hemoglobin, or a trending NLR — patterns that a standard lab review might wave off as 'normal' — Ones' AI health practitioner can incorporate those signals into a formula built specifically around what your blood is telling it.
---
Key Takeaways
- Standard CBC reference ranges flag disease, not optimal function. Functional optimal ranges are narrower and more clinically meaningful for energy, immunity, and long-term health.
- Hemoglobin and hematocrit in the lower quartile of 'normal' can still impair energy and performance — look upstream at ferritin, B12, and folate before assuming dietary iron is the issue.
- MCV and RDW together tell a nutritional story: low MCV points to iron deficiency; high MCV points to B12/folate deficiency; elevated RDW often signals mixed deficiencies or chronic inflammation.
- Your WBC differential is an immune health snapshot — neutrophil-to-lymphocyte ratio above 2.5 and eosinophils above 3% are functional red flags even within standard ranges.
- MPV above 11.0 fL warrants attention as a cardiovascular and inflammatory risk marker, addressable with omega-3s, magnesium, and CoQ10.
- Ones translates CBC patterns into precise supplement formulas — using your actual lab values to dose Omega-3, Magnesium Complex, Vitamin D3+K2, Zinc, NAC, and other clinically validated ingredients at ranges that match the evidence.
> Always consult a licensed healthcare provider before making decisions based on lab results. This article is for educational purposes and does not constitute medical advice.