Lab Results
Comprehensive Metabolic Panel Explained: Optimal Ranges, Warning Signs, and Targeted Support
Your doctor says your comprehensive metabolic panel looks "normal" — but normal and optimal are not the same thing. Up to 40% of people with metabolic dysfunction fall within standard reference ranges yet still experience fatigue, brain fog, and poor blood sugar control. Understanding what your CMP numbers actually mean — and where they should ideally sit — is the first step toward targeted, evidence-based support.
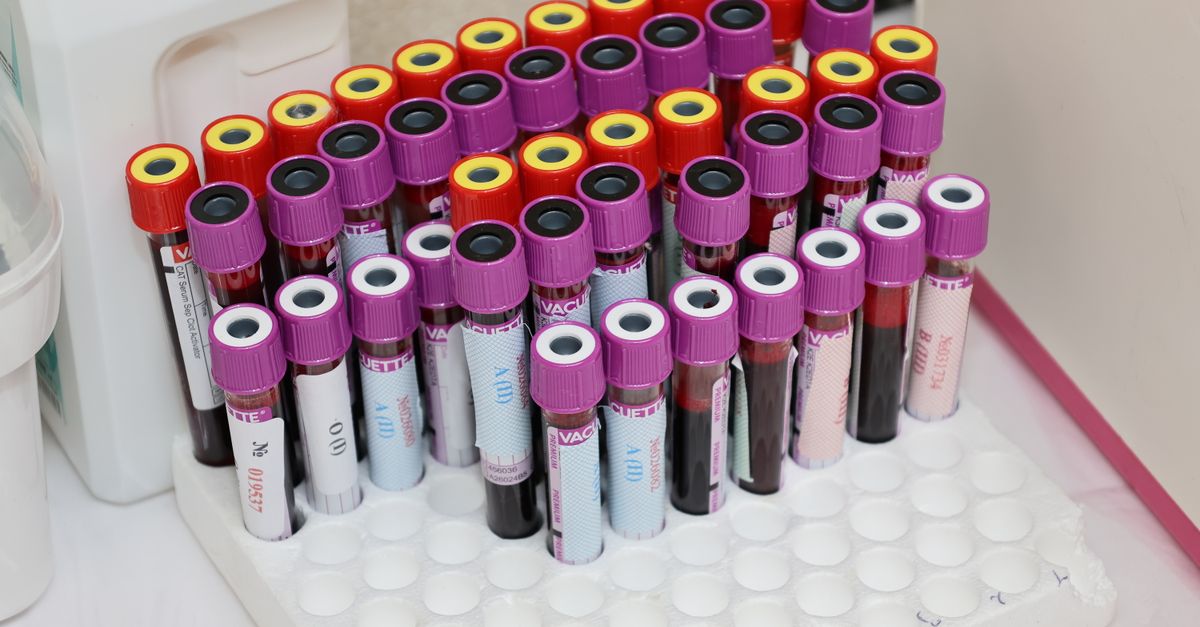
What Is a Comprehensive Metabolic Panel and Why Does It Matter?
A comprehensive metabolic panel (CMP) is a standard blood test that measures 14 biomarkers across four major physiological systems: kidney function, liver function, electrolyte and fluid balance, and blood sugar regulation. Ordered routinely at annual physicals or to monitor chronic conditions, it provides a rapid snapshot of how your body's core chemistry is functioning.
The problem is that most patients receive their CMP results framed only as pass/fail — within or outside the lab's reference range. Reference ranges are calculated from statistical distributions of a mixed population, not from research on what levels are associated with optimal health outcomes. A fasting glucose of 99 mg/dL and a fasting glucose of 72 mg/dL may both be "normal," but they carry very different long-term implications for metabolic health (American Diabetes Association, Diabetes Care 2021; doi.org/10.2337/dc21-S002).
This guide walks through every major CMP marker, explains the difference between lab reference ranges and clinically optimal ranges, flags the warning signs worth discussing with your provider, and outlines the nutritional levers that can support each system.
---
CMP Biomarkers at a Glance: Reference vs. Optimal Ranges
The table below compares standard lab reference ranges with the tighter, outcome-based optimal ranges used by functional and integrative practitioners. These optimal values draw on peer-reviewed metabolic research — they are not arbitrary tightening.
| Biomarker | Standard Reference Range | Functional Optimal Range | Primary System |
|---|---|---|---|
| Glucose (fasting) | 70–99 mg/dL | 72–85 mg/dL | Blood sugar |
| BUN (blood urea nitrogen) | 7–25 mg/dL | 10–16 mg/dL | Kidney / protein metabolism |
| Creatinine | 0.6–1.2 mg/dL (M) / 0.5–1.1 (F) | 0.8–1.1 mg/dL (M) / 0.6–0.9 (F) | Kidney filtration |
| eGFR | ≥60 mL/min/1.73m² | ≥90 mL/min/1.73m² | Kidney function |
| Sodium | 136–145 mEq/L | 138–142 mEq/L | Electrolyte balance |
| Potassium | 3.5–5.1 mEq/L | 4.0–4.5 mEq/L | Electrolyte / cardiac |
| CO₂ (bicarbonate) | 22–29 mEq/L | 25–28 mEq/L | Acid-base balance |
| Chloride | 98–107 mEq/L | 100–106 mEq/L | Electrolyte balance |
| Calcium | 8.5–10.5 mg/dL | 9.2–9.8 mg/dL | Bone / neuromuscular |
| Total protein | 6.0–8.3 g/dL | 6.9–7.4 g/dL | Nutritional status |
| Albumin | 3.5–5.0 g/dL | 4.0–4.8 g/dL | Liver / nutrition |
| Total bilirubin | 0.1–1.2 mg/dL | 0.3–0.9 mg/dL | Liver / hemolysis |
| ALT (SGPT) | 7–56 U/L | 10–25 U/L | Liver cell integrity |
| AST (SGOT) | 10–40 U/L | 10–25 U/L | Liver / muscle |
Optimal ranges are population-health reference points, not diagnostic thresholds. Always interpret results with your healthcare provider.
---
Blood Sugar Markers: Glucose and the Pre-Diabetes Blind Spot
Fasting glucose is arguably the most consequential single marker on a CMP. A value between 100–125 mg/dL meets the clinical definition of pre-diabetes, yet many people in the 90–99 mg/dL range are already showing early insulin resistance when more sensitive markers — fasting insulin, HOMA-IR — are added to the picture.
A 2016 analysis in the Journal of Clinical Endocrinology & Metabolism found that individuals with fasting glucose between 91–99 mg/dL had a significantly elevated risk of progressing to type 2 diabetes compared to those below 90 mg/dL, even though both groups are technically "normal" (Nichols et al., JCEM 2016; PMID: 27003304).
Warning signs to watch:
- Fasting glucose trending upward year over year, even within range
- Post-meal energy crashes suggesting impaired glucose disposal
- Elevated triglycerides (on a lipid panel) co-occurring with high-normal glucose — a pattern consistent with insulin resistance
Magnesium is a critical co-factor for insulin receptor signaling. A large meta-analysis of 13 prospective cohort studies found that higher dietary magnesium intake was associated with a significant reduction in type 2 diabetes risk (Dong et al., Diabetes Care 2011; PMID: 21868780). Many adults are chronically under-replete, making this one of the most evidence-supported nutritional interventions for blood sugar support.
For a deeper dive into how blood sugar markers interact with energy levels, see how magnesium affects insulin sensitivity and metabolic health.
---
Liver Markers: ALT, AST, and What "Slightly Elevated" Really Means
ALT and AST are enzymes released when liver cells are damaged. Elevations — even mild ones — are clinically meaningful because the liver is involved in detoxification, protein synthesis, cholesterol regulation, and conversion of thyroid hormone from T4 to active T3.
A 2023 study published in Hepatology Communications confirmed that ALT levels above 25 U/L in women and 35 U/L in men — both values frequently within standard lab reference ranges — were associated with histologic evidence of metabolic-associated fatty liver disease (MASLD) in otherwise asymptomatic individuals (Allen et al., Hepatol Commun 2023; doi.org/10.1097/HC9.0000000000000012).
An elevated AST-to-ALT ratio (>2:1) shifts concern toward alcohol-related liver stress or muscle breakdown rather than hepatocellular injury.
Warning signs to watch:
- ALT persistently above 25 U/L (especially in women)
- AST:ALT ratio creeping above 1.5
- Low albumin (<4.0 g/dL) combined with high bilirubin — a pattern suggesting compromised synthetic liver function
- High-normal bilirubin (>0.9 mg/dL) without obvious cause may warrant investigation for Gilbert's syndrome or hemolysis
From a nutritional standpoint, compounds that support hepatic glutathione synthesis and mitochondrial function in hepatocytes are well-studied. N-acetylcysteine (NAC), milk thistle (silymarin), and alpha-lipoic acid all have documented mechanisms for supporting liver cell health. Ones includes a proprietary Liver Support blend that combines these evidence-backed botanicals at clinically researched concentrations — an option that can be included in a custom formula when liver markers are flagged during intake review.
---
Kidney Function Markers: BUN, Creatinine, and eGFR
The kidneys filter approximately 180 liters of blood per day. Creatinine (a waste product of muscle metabolism) and BUN (a breakdown product of protein metabolism) are both cleared by healthy kidneys. When filtration slows, these markers accumulate.
eGFR (estimated glomerular filtration rate) is calculated from creatinine, age, sex, and race, and is the most sensitive CMP indicator of early kidney function decline. An eGFR between 60–89 mL/min/1.73m² is classified as G2 (mildly decreased), yet this range is commonly reported as "normal."
Interpreting BUN in context:
BUN can be elevated not just by kidney dysfunction but also by dehydration, high protein intake, or gastrointestinal bleeding. A BUN-to-creatinine ratio above 20:1 typically points to a pre-renal (dehydration or low renal blood flow) cause rather than intrinsic kidney damage.
Conversely, very low BUN (<10 mg/dL) can reflect poor protein intake or advanced liver disease impairing urea synthesis.
Warning signs to watch:
- eGFR declining trend across consecutive annual tests, even above 60
- BUN:creatinine ratio >20 with low fluid intake
- Creatinine rising year-over-year in a non-athletic individual (athletes have higher muscle mass and may run physiologically elevated creatinine)
Ones includes a Kidney & Bladder Support blend for users whose biomarker patterns suggest this system needs additional attention — formulated to work alongside, not replace, medical management.
---
Electrolytes and Calcium: Small Shifts, Large Consequences
Sodium, potassium, chloride, CO₂ (bicarbonate), and calcium are tightly regulated. Even small deviations from optimal can signal meaningful physiological disruption.
Potassium is particularly important for cardiac rhythm and muscle contraction. A potassium level between 3.5–3.9 mEq/L is within range but in the low-normal zone associated with increased cardiovascular risk. Diuretic medications, low vegetable intake, and chronic stress (via cortisol-driven urinary potassium loss) are common contributors.
Calcium interpretation requires context. Elevated calcium (hypercalcemia) should always prompt investigation for primary hyperparathyroidism or, less commonly, malignancy — it is not a benign finding. Low calcium, meanwhile, can result from vitamin D deficiency, hypomagnesemia, or hypoparathyroidism. Because magnesium is required for parathyroid hormone secretion and vitamin D activation, persistent low-normal calcium sometimes resolves with magnesium repletion rather than direct calcium supplementation (Rude et al., Journal of the American College of Nutrition 2009; PMID: 19515738).
CO₂/Bicarbonate reflects acid-base balance. A value below 24 mEq/L may indicate a low-grade metabolic acidosis — sometimes seen with high-protein diets, early kidney disease, or chronic diarrhea — which carries implications for bone mineral density and muscle preservation over time.
---
Total Protein and Albumin: Nutritional and Liver Status Signals
Total protein and albumin are quiet but important nutritional markers. Albumin has a serum half-life of roughly 20 days, making it a medium-term indicator of protein adequacy and liver synthetic function.
Albumin below 4.0 g/dL is associated with increased all-cause mortality risk in population studies, even in the absence of diagnosed disease (Goldwasser & Feldman, Nephrology Dialysis Transplantation 1997 — a foundational reference). In clinical practice, low albumin is often linked to inadequate protein intake, malabsorption, or chronic inflammation (as albumin is a negative acute-phase reactant that drops during inflammatory states).
---
What This Means for Your Formula
A CMP does not exist in isolation — it is a set of interdependent data points best interpreted alongside other labs, wearable metrics, and symptoms. This is precisely where personalized supplementation becomes more than a one-size-fits-all multivitamin.
Ones analyzes your CMP alongside other available biomarkers to identify which systems are under stress and which nutrient gaps are most likely contributing. Three ingredients that commonly emerge as relevant:
Magnesium Glycinate — included at clinically meaningful doses within Ones formulas, magnesium glycinate addresses one of the most common nutrient gaps affecting blood sugar regulation, CO₂ balance, calcium metabolism, and electrolyte equilibration simultaneously. The glycinate form is favored for its superior bioavailability and gastrointestinal tolerability.
Liver Support (proprietary blend) — for users with ALT trending above optimal or elevated bilirubin, this blend provides silymarin, NAC, and alpha-lipoic acid — compounds with documented hepatoprotective mechanisms. This is not a one-size addition; it only appears in formulas where Ones identifies liver system stress in the data.
Omega-3 (EPA/DHA) — relevant to multiple CMP systems. EPA and DHA at doses of 2–4g/day have been shown in randomized controlled trials to reduce hepatic fat in metabolic fatty liver disease and to support healthy triglyceride levels that often co-pattern with high-normal glucose (Sanyal et al., Hepatology 2010; PMID: 20578136). Ones includes pharmaceutical-grade omega-3 dosed to clinical ranges, not token amounts.
If your CMP shows patterns across liver, kidney, or glucose markers, reviewing those results through Ones' AI health practitioner allows for a layered, data-driven formula — rather than guessing which supplements to add.
Learn how CMP data pairs with thyroid labs to build a complete metabolic picture: thyroid lab results and functional ranges explained.
For context on how metabolic and liver markers interact with hormonal health, see how liver detoxification affects hormone balance.
---
Key Takeaways
- A comprehensive metabolic panel measures 14 biomarkers across kidney, liver, electrolyte, and blood sugar systems — but standard reference ranges are based on population averages, not optimal health outcomes.
- Fasting glucose between 91–99 mg/dL, though "normal," is associated with elevated diabetes progression risk; optimal functional range is 72–85 mg/dL.
- ALT above 25 U/L (women) or 35 U/L (men) may indicate early liver stress even when reported as within range — and often responds to targeted nutritional support.
- Calcium, CO₂, and potassium should be interpreted together with magnesium status; hypomagnesemia can drive low-normal readings across all three without appearing as a standalone deficiency.
- Albumin and total protein are nutritional sentinel markers — low albumin below 4.0 g/dL warrants investigation into protein intake, absorption, and inflammatory load.
- Ones analyzes your CMP in context — pairing biomarker patterns with ingredient options like magnesium glycinate, Liver Support, and omega-3 EPA/DHA at clinical doses — to build a formula calibrated to your actual data, not a general health profile.