Lab Results
What Is an Optimal Fasting Insulin Level?: Why "In Range" Isn't Always "Optimal"
Your fasting insulin came back 'normal' — so why are you still gaining weight, craving sugar, and waking up exhausted? Standard lab reference ranges for insulin are drawn from population averages that include millions of people already on the road to metabolic disease. Understanding what an optimal fasting insulin level actually looks like — not just an acceptable one — can be the difference between catching insulin resistance early and missing it by a decade.
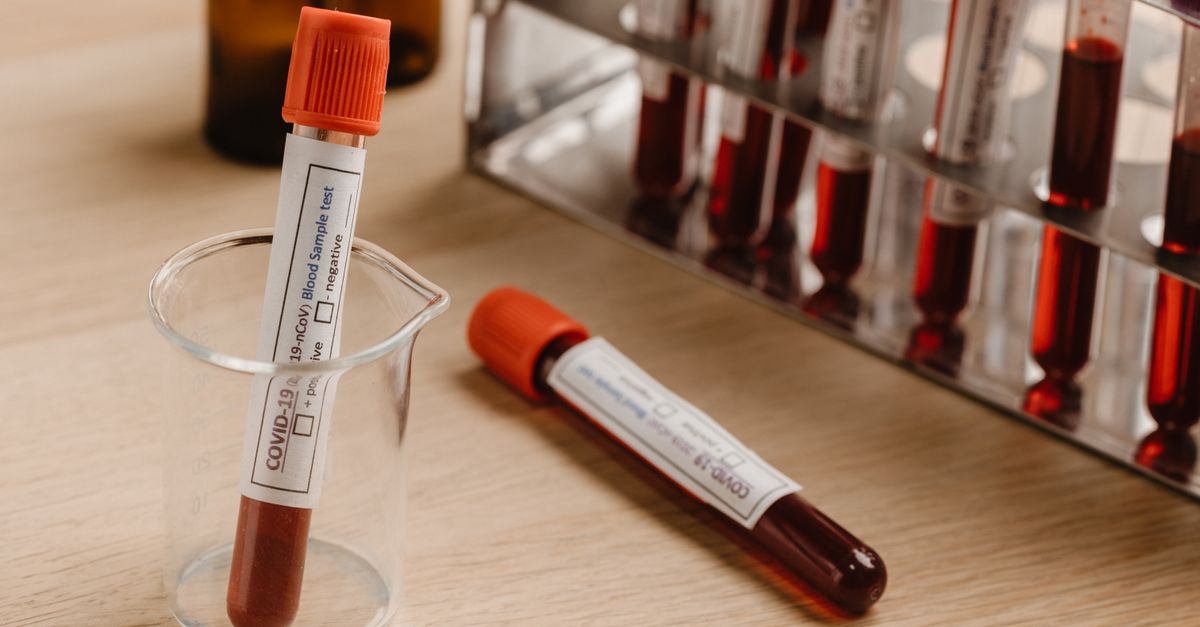
What Your Lab Report Won't Tell You About Fasting Insulin
Fasting insulin is one of the most revealing metabolic biomarkers available, yet it is routinely overlooked on standard panels, and when it is measured, the reference range printed on the report can be deeply misleading. Most commercial labs flag insulin as abnormal only when it climbs above 25 µIU/mL or even higher. But emerging metabolic research suggests that meaningful insulin resistance — and its downstream cardiovascular, hormonal, and cognitive consequences — begins well before that threshold.
The question isn't just "what is a normal fasting insulin level?" It's "what is an optimal fasting insulin level?" — and those two answers are not the same.
---
What Is a Normal Fasting Insulin Level? (And Why Normal Isn't Enough)
The conventional reference range for fasting insulin varies by laboratory, but most list the upper limit of normal somewhere between 17 and 25 µIU/mL. A patient at 22 µIU/mL receives a "normal" result. Clinically, however, that individual may already have measurable insulin resistance, elevated triglycerides, and a trajectory toward type 2 diabetes.
The problem is that laboratory reference ranges are derived statistically from the general population — typically the middle 95% of tested individuals. When a large portion of that population is metabolically unhealthy (the CDC estimates more than one-third of U.S. adults have prediabetes, most undiagnosed), the "normal" range shifts upward to accommodate disease, not health.
A landmark analysis published in Diabetes Care found that insulin sensitivity begins to decline at fasting insulin levels well within the conventional normal range, and that individuals with fasting insulin above 7–10 µIU/mL already show measurable increases in cardiovascular risk markers (Hanley et al., 2002; PMID: 12196431).
Functional and integrative medicine practitioners widely use a tighter optimal window:
| Category | Fasting Insulin (µIU/mL) |
|---|---|
| Optimal | 2 – 6 |
| Acceptable | 6 – 10 |
| Early insulin resistance concern | 10 – 17 |
| Conventional "upper normal" | up to 25 |
| Overt insulin resistance | > 25 |
If your value is 14 µIU/mL and the lab says "normal," that's a conversation worth having with your provider — because your biology may already be compensating.
---
What Is an Optimal Fasting Glucose Level? (The Companion Biomarker)
Fasting insulin is rarely interpreted in isolation. It becomes most powerful when read alongside fasting glucose, and together they can be used to calculate HOMA-IR (Homeostatic Model Assessment of Insulin Resistance): HOMA-IR = (fasting glucose in mg/dL × fasting insulin in µIU/mL) ÷ 405.
So what is an optimal fasting glucose level? Again, official guidelines define a normal fasting glucose as below 100 mg/dL, with prediabetes beginning at 100–125 mg/dL. But the optimal zone — the range associated with the lowest all-cause mortality and best cognitive performance — is considerably tighter.
| Category | Fasting Glucose (mg/dL) |
|---|---|
| Optimal | 70 – 85 |
| Acceptable | 85 – 99 |
| Prediabetes | 100 – 125 |
| Type 2 Diabetes | ≥ 126 |
A HOMA-IR below 1.0 is generally considered optimal. Values above 1.9 indicate early insulin resistance; above 2.9 suggests significant resistance (Wallace et al., Diabetes Care 2004; PMID: 14747229).
Here's why the pairing matters: a person can have a fasting glucose of 92 mg/dL (reassuringly normal) but a fasting insulin of 18 µIU/mL, yielding a HOMA-IR of 4.1 — firmly in the insulin-resistant range. The pancreas is working overtime to keep glucose normal. That compensation won't last forever.
Tracking both markers, ideally with a wearable continuous glucose monitor layered on top, paints a far more accurate metabolic picture than either number alone. Platforms like Ones integrate blood lab data with wearable glucose trend data to identify patterns that a single fasting draw can miss.
---
Why Fasting Insulin Resistance Has Whole-Body Consequences
Insulin resistance isn't just a diabetes precursor. Elevated insulin signals dysregulate almost every major hormonal axis in the body:
- Reproductive hormones: High insulin stimulates ovarian androgen production, contributing to polycystic ovarian syndrome (PCOS). A meta-analysis of 35 trials found insulin-sensitizing interventions significantly reduced free androgen index in women with PCOS (Palomba et al., Human Reproduction Update 2009; PMID: 19054777).
- Cortisol and HPA axis: Chronic hyperinsulinemia elevates cortisol output, creating a feedback loop that further impairs insulin sensitivity.
- Thyroid function: Insulin resistance is independently associated with higher TSH and lower free T4, which brings us to the next critical biomarker.
- Cardiovascular risk: Even modest hyperinsulinemia (fasting insulin 10–20 µIU/mL) is associated with a significantly elevated risk of hypertension, dyslipidemia, and cardiovascular events (Reaven, Physiology & Behavior 2004; PMID: 15327779).
Understanding the metabolic cascade that begins with suboptimal insulin levels is why a truly personalized approach to supplementation and lifestyle must start with your actual lab data — not a one-size-fits-all formula.
---
What Is an Optimal Free T4 Level? (The Insulin–Thyroid Connection)
This connection surprises many people: the same metabolic dysfunction driving high fasting insulin often suppresses thyroid output. Free T4 (thyroxine) is the main thyroid hormone produced by the gland; it converts peripherally to the active form, free T3.
Standard lab reference ranges for free T4 typically span 0.8–1.8 ng/dL. But optimal free T4 — the level associated with peak energy, normal body weight, and intact cognitive function — is generally considered to be in the upper half of that range, approximately 1.1–1.4 ng/dL, according to thyroid specialists who interpret results in clinical context rather than against population averages alone.
Insulin resistance impairs the peripheral conversion of T4 to T3, meaning a patient can have an adequate free T4 but still experience hypothyroid symptoms because downstream conversion is blocked. This is one reason why treating metabolic dysfunction at the root — improving insulin sensitivity — often resolves mild thyroid complaints without thyroid-specific intervention.
---
What Is an Optimal Thyroid Antibodies Level? (When the Immune System Is Involved)
When free T4 trends low and TSH trends high, the next investigative step is usually thyroid antibody testing — specifically TPO antibodies (thyroid peroxidase) and anti-thyroglobulin antibodies. These markers reveal whether an autoimmune process (Hashimoto's thyroiditis) is driving thyroid dysfunction.
The "normal" threshold for TPO antibodies is typically set at less than 34–35 IU/mL by most labs. But what is an optimal thyroid antibodies level? Functionally, lower is always better. Even TPO antibody levels in the 20–34 IU/mL range — technically "normal" — can reflect low-grade immune activation that is progressively damaging thyroid tissue.
Critically, elevated TPO antibodies are not isolated to the thyroid. Research has documented a significant bidirectional relationship between insulin resistance and autoimmune thyroid disease. A study published in Thyroid found that HOMA-IR was significantly elevated in patients with Hashimoto's thyroiditis compared to healthy controls, independent of BMI (Sfiscini et al., Thyroid 2017).
This is why the biomarker picture must be read as a system, not a checklist. Elevated fasting insulin, borderline-low free T4, and creeping TPO antibodies may each look "acceptable" in isolation — but together they describe a person who is metabolically and immunologically stressed and whose formula needs to reflect that complexity.
---
Lifestyle Drivers of High Fasting Insulin
Before reaching for supplements, it's worth mapping the behavioral inputs most strongly associated with elevated fasting insulin:
- Excess refined carbohydrate intake — particularly fructose from ultra-processed foods, which is preferentially metabolized in the liver and drives de novo lipogenesis and hepatic insulin resistance.
- Sedentary behavior — skeletal muscle is the primary site of insulin-stimulated glucose disposal; inactivity dramatically reduces this capacity.
- Sleep deprivation — even one week of sleeping fewer than 6 hours significantly increases fasting insulin and HOMA-IR in healthy adults (Spiegel et al., Sleep 2005; PMID: 16335329).
- Chronic psychological stress — via cortisol-driven gluconeogenesis and catecholamine-mediated insulin resistance.
- Visceral adiposity — particularly abdominal fat, which releases free fatty acids and pro-inflammatory cytokines that directly impair insulin signaling.
Addressing these drivers is the non-negotiable foundation. Targeted nutritional support is additive, not substitutive.
---
What This Means for Your Formula
When Ones analyzes a user's blood results and wearable data, fasting insulin (or HOMA-IR if both glucose and insulin are available) is treated as one of the most actionable metabolic signals in the panel. High insulin doesn't trigger a single-ingredient response — it informs a layered approach.
Several ingredients in the Ones catalog have direct clinical relevance to insulin sensitivity and the metabolic-thyroid connection described in this article:
Berberine (where formulated) — Berberine activates AMPK, the cellular energy-sensing enzyme, and has been shown in multiple RCTs to reduce fasting glucose, fasting insulin, and HOMA-IR comparably to metformin at doses of 1,000–1,500 mg/day. A meta-analysis of 14 trials confirmed significant reductions in fasting insulin (mean reduction ~2.3 µIU/mL) relative to placebo.
Omega-3 (EPA/DHA) — Ones includes pharmaceutical-grade omega-3 calibrated to EPA/DHA output. A 2013 meta-analysis of 18 RCTs found that omega-3 supplementation significantly reduced fasting triglycerides (a direct marker of insulin resistance) and modestly improved insulin sensitivity in metabolically at-risk individuals (Akinkuolie et al., Journal of Clinical Lipidology 2011; PMID: 22108155). For users whose lab results reveal dyslipidemia alongside elevated insulin, omega-3 addresses both vectors simultaneously.
Thyroid Support (System Blend) — For users where the fasting insulin picture connects to borderline thyroid markers, Ones' proprietary Thyroid Support blend addresses the underlying micronutrient depletions (including selenium and iodine) that can impair both T4 production and T4-to-T3 conversion. Selenium at 200 mcg selenomethionine has been shown to meaningfully reduce TPO antibody titers in Hashimoto's patients (Gärtner et al., Journal of Clinical Endocrinology & Metabolism 2002; PMID: 11932302).
The formula Ones builds doesn't assume every user with high insulin needs the same response. A 6-capsule plan for a 34-year-old woman with PCOS-associated insulin resistance looks very different from the plan built for a 52-year-old man with metabolic syndrome markers — because the AI is reading the full picture, not pattern-matching to a single lab value.
---
Key Takeaways
- "Normal" fasting insulin is not the same as optimal. Most labs flag insulin only above 17–25 µIU/mL; functional optimal is 2–6 µIU/mL, and values above 10 µIU/mL warrant attention.
- HOMA-IR gives context. Pairing fasting insulin with fasting glucose using the HOMA-IR formula (target < 1.0) reveals insulin resistance that either number misses alone.
- Fasting glucose optimal is 70–85 mg/dL, not merely "under 100" — the difference matters for long-term metabolic health.
- Insulin resistance suppresses thyroid function, particularly peripheral T4-to-T3 conversion, which means optimizing insulin can improve thyroid symptoms even without thyroid-specific treatment.
- TPO antibodies trend lower is better — even values within the "normal" range alongside a high HOMA-IR suggest a meaningful immune-metabolic interaction worth monitoring.
- Sleep, movement, and stress management are foundational — targeted supplementation is most effective when layered on top of these behaviors, not used instead of them.
---
This article is for educational purposes only and does not constitute medical advice. Consult a licensed healthcare provider before making changes to your supplement or medication regimen based on lab results.