Lab Results
What Is a Normal Fasting Glucose Level?: A Functional-Medicine Interpretation Guide
Your lab report says your fasting glucose is 95 mg/dL — technically 'normal' — but functional-medicine practitioners flag anything above 85 as a warning sign worth investigating. Millions of Americans are metabolically stressed years before a diabetes diagnosis appears on paper. Understanding the difference between a reference range and an optimal range could be one of the most important distinctions you ever make about your health.
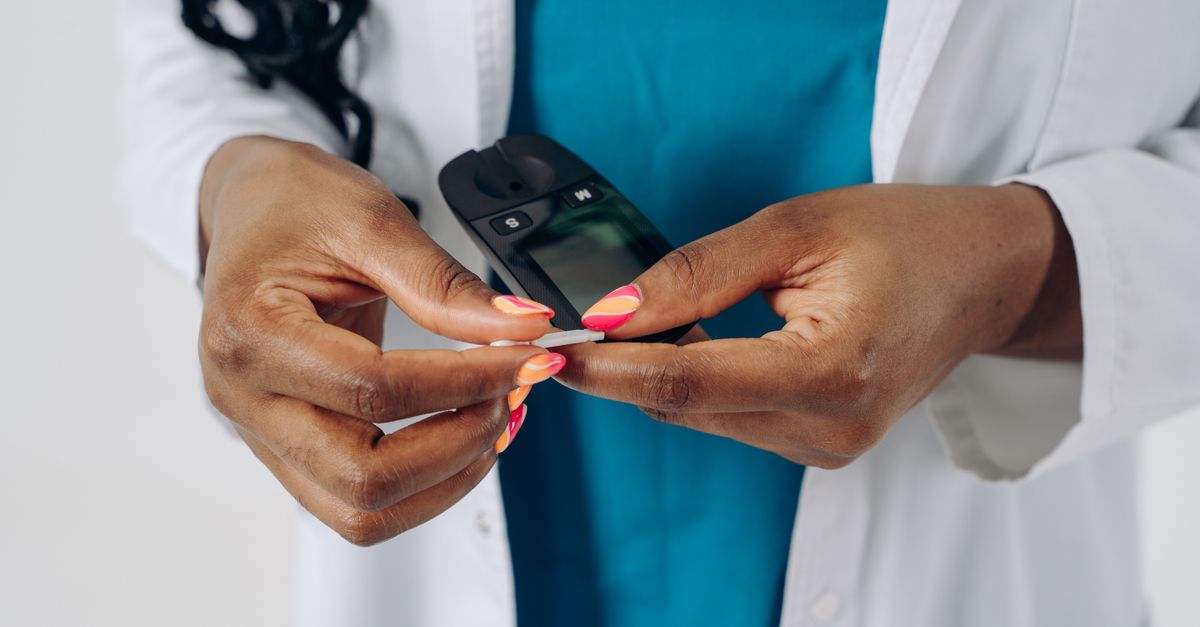
What 'Normal' Fasting Glucose Actually Means — and Where It Falls Short
Standard laboratory reference ranges for fasting blood glucose typically run from 70–99 mg/dL, with values between 100–125 mg/dL classified as prediabetes and anything at or above 126 mg/dL on two separate readings classified as type 2 diabetes (American Diabetes Association Standards of Medical Care, 2023). These thresholds were designed to identify disease — not to preserve optimal metabolic health.
A fasting glucose of 98 mg/dL will sail through a routine physical with a green checkmark. Yet large prospective data tell a more sobering story. The Whitehall II cohort study found that individuals with fasting glucose levels between 95–99 mg/dL had significantly elevated risk for future type 2 diabetes compared to those under 85 mg/dL, even after adjusting for BMI and physical activity (Tabák et al., Lancet, 2009; PMID: 19515410). That 15-point range — 85 to 99 — is where functional and integrative practitioners spend a lot of their time.
So what is a normal fasting glucose level versus an optimal one? The answer depends entirely on what question you're asking.
---
What Is an Optimal Fasting Glucose Level?
Functional-medicine practitioners generally consider the optimal fasting glucose range to be 70–85 mg/dL. This tighter window reflects a glucose-insulin axis that is working efficiently — cells are sensitive to insulin, the liver is not over-releasing glycogen overnight, and inflammation markers related to glycation are typically lower.
Here's how the ranges stack up:
| Classification | Fasting Glucose (mg/dL) | Interpretation |
|---|---|---|
| Optimal (functional) | 70–85 | Excellent insulin sensitivity |
| Acceptable | 86–99 | Within reference range; watch trend |
| Impaired (prediabetes) | 100–125 | Elevated risk; intervention warranted |
| Diabetic threshold | ≥ 126 | Confirmed on two occasions = T2DM |
The clinical reasoning here is glycation. Hemoglobin A1c — a measure of average blood sugar over ~90 days — begins to rise meaningfully even when fasting glucose sits in the high-normal range. A 2010 analysis published in Diabetes Care demonstrated that individuals with fasting glucose of 90–99 mg/dL had measurably higher HbA1c trajectories over five years compared to those consistently below 85 mg/dL (Nichols et al., Diabetes Care, 2010; PMID: 19880583). Glycated proteins contribute to endothelial damage, accelerated aging, and organ stress — processes that don't wait for a clinical diabetes diagnosis to get started.
For context, continuous glucose monitor (CGM) data from metabolically healthy, non-diabetic adults typically shows mean glucose values of 79–100 mg/dL with very limited time spent above 120 mg/dL even postprandially (Shah et al., PLOS Biology, 2019; PMID: 31141483). When your fasting number sits chronically at 95–99, it suggests your baseline is already elevated before you add the postprandial spike on top.
---
What Is a Normal Fasting Insulin Level?
Fasting glucose doesn't tell the whole story. You can have a fasting glucose of 82 mg/dL — picture-perfect by any standard — and still be in the early stages of insulin resistance. How? Because your pancreas is working overtime to keep glucose in check, secreting 3–4 times more insulin than a metabolically healthy person requires. This is what functional practitioners call compensatory hyperinsulinemia, and a standard metabolic panel will miss it entirely because fasting insulin is not included in routine bloodwork.
The conventional reference range for fasting insulin is roughly 2–25 µIU/mL, but most functional-medicine clinicians consider anything above 8–10 µIU/mL worth investigating in a fasting state. Optimal fasting insulin is generally cited as 2–6 µIU/mL.
| Classification | Fasting Insulin (µIU/mL) | Clinical Note |
|---|---|---|
| Optimal | 2–6 | High insulin sensitivity |
| Acceptable | 7–10 | Monitor with glucose trends |
| Elevated | 11–20 | Suggests early insulin resistance |
| High | > 20 | Significant resistance; evaluate further |
When you have both fasting glucose and fasting insulin, you can calculate HOMA-IR (Homeostatic Model Assessment of Insulin Resistance):
> HOMA-IR = (Fasting Glucose in mg/dL × Fasting Insulin in µIU/mL) ÷ 405
A HOMA-IR below 1.0 is generally considered optimal. Values above 1.9 indicate early insulin resistance; above 2.9 suggests significant resistance. Research using HOMA-IR has demonstrated that elevated scores predict cardiovascular events, nonalcoholic fatty liver disease, and cognitive decline years before glucose dysregulation becomes clinically apparent (Bonora et al., Diabetes Care, 2002; PMID: 12196436).
If you've received blood work back and want to understand what the numbers mean in context, understanding your metabolic panel results is a useful starting point for the full picture.
---
Why Thyroid Function Intersects With Blood Sugar Metabolism
Blood sugar dysregulation rarely exists in isolation. One of the most clinically underappreciated connections is between thyroid function and glucose metabolism. The thyroid gland governs cellular energy production, and when thyroid hormone output is suboptimal — even subclinically — insulin sensitivity, glucose uptake, and lipid metabolism are all impaired.
This is why a thorough metabolic workup should include thyroid markers alongside fasting glucose and insulin.
What Is a Normal Thyroid Antibodies Level?
Thyroid antibodies — specifically anti-TPO (thyroid peroxidase antibodies) and anti-TG (thyroglobulin antibodies) — are markers of autoimmune thyroid activity, most commonly Hashimoto's thyroiditis. Standard reference ranges typically flag anti-TPO above 35 IU/mL as elevated, though some labs use cutoffs up to 60 IU/mL.
From a functional perspective, any detectable elevation in thyroid antibodies — even within the lab's "normal" range — warrants monitoring and lifestyle intervention, because antibody burden often precedes overt hypothyroidism by years or decades. Elevated anti-TPO has been associated with increased cardiovascular risk, metabolic syndrome components, and dysglycemia even in euthyroid individuals (Völzke et al., Journal of Clinical Endocrinology & Metabolism, 2005).
The thyroid-glucose connection operates through several mechanisms:
- Thyroid hormones upregulate GLUT-4 transporters, which shuttle glucose into muscle cells
- Hypothyroid states reduce hepatic glucose clearance
- Low T3 impairs insulin receptor signaling
This means a person with borderline-low thyroid function and a fasting glucose of 96 mg/dL may be facing two synergistic metabolic stressors simultaneously — neither of which is severe enough to trigger a diagnosis in isolation, but together, they meaningfully elevate long-term risk.
What Is a Normal Free T4 Level?
Free T4 (thyroxine, unbound) is the inactive precursor that gets converted to the active T3 form in peripheral tissues. Standard laboratory reference ranges for free T4 run approximately 0.8–1.8 ng/dL, though most functional-medicine practitioners prefer to see values in the 1.0–1.5 ng/dL range for optimal metabolic support.
A free T4 at the lower end of the reference range (e.g., 0.85 ng/dL) combined with a TSH creeping toward the upper boundary (e.g., 3.5–4.5 mIU/L) often signals that the thyroid is working harder to maintain output — a pattern that can suppress metabolic rate, worsen insulin sensitivity, and push fasting glucose upward over time. Checking free T4 alongside TSH gives a much more complete picture than TSH alone.
For a deeper dive into interpreting thyroid panels in functional context, optimal TSH and thyroid panel reference ranges covers the full spectrum of markers.
---
Lifestyle Levers That Move Fasting Glucose
Fasting glucose responds remarkably well to targeted lifestyle changes — often within 4–8 weeks of consistent effort:
- Time-restricted eating (12–16 hour overnight fast): Extends the nocturnal fast, allowing insulin to fall and glucagon to promote hepatic glucose clearance.
- Resistance training: Increases GLUT-4 expression in skeletal muscle independent of insulin, lowering fasting values by 3–8 mg/dL in controlled trials.
- Fiber intake: Soluble fiber (10–30g/day) slows gastric emptying, blunts postprandial glucose spikes, and reduces fasting insulin over time.
- Sleep optimization: A single night of partial sleep deprivation (4–5 hours) raises fasting glucose by 5–10 mg/dL in healthy adults — chronic poor sleep is a genuine glycemic stressor.
- Stress reduction: Cortisol is directly gluconeogenic. Elevated cortisol from psychological or physiological stress can raise fasting glucose even in the absence of dietary change. For more on this pathway, how cortisol affects blood sugar and metabolism explains the HPA-glucose axis in detail.
---
What This Means for Your Formula
When Ones analyzes your bloodwork, wearable data, and health history, fasting glucose and insulin aren't read as standalone numbers — they're interpreted in context of each other, your HbA1c trend, sleep metrics, activity patterns, and inflammatory markers. That integrated picture determines which ingredients are clinically warranted and at what doses.
For individuals with fasting glucose trending above 85 mg/dL or elevated HOMA-IR, several ingredients in the Ones catalog become particularly relevant:
- Berberine (500mg): One of the most studied botanicals for insulin sensitization, berberine activates AMPK — the same pathway targeted by metformin — and has been shown to reduce fasting glucose by an average of 20% in randomized trials of individuals with prediabetes and type 2 diabetes. A 2008 RCT in Metabolism (PMID: 18460207) found berberine comparable to metformin for glycemic control over 13 weeks.
- Alpha-lipoic acid (ALA, 600mg): A mitochondrial antioxidant that improves insulin-stimulated glucose uptake in skeletal muscle. ALA has been studied extensively for both glycemic control and diabetic neuropathy, with a strong safety profile at 600mg daily.
- Chromium (as chromium picolinate, 200–400mcg): Chromium is a cofactor for insulin receptor function. Deficiency — common in processed-food-heavy diets — impairs the insulin signaling cascade. Research in Diabetes Care has documented meaningful reductions in fasting glucose with chromium picolinate supplementation in insulin-resistant individuals.
For individuals where the thyroid-glucose connection appears relevant based on borderline thyroid markers, Ones may also incorporate its Thyroid Support System Blend, which is formulated to support healthy thyroid hormone synthesis and conversion — a distinction that matters when low-normal free T4 is compounding metabolic stress.
Formulas are calibrated to either a 6 or 9-capsule daily plan based on what the AI identifies from your data — so the combination and dosing are driven by your specific findings, not a one-size-fits-all template.
---
Key Takeaways
- Standard reference ranges (70–99 mg/dL) were designed to detect disease, not optimize health. Functional practitioners consider 70–85 mg/dL the optimal fasting glucose range.
- Fasting insulin is the missing piece. A normal fasting glucose with elevated fasting insulin (above 8–10 µIU/mL) still indicates insulin resistance. HOMA-IR puts both numbers in context.
- The thyroid-glucose connection is real and underappreciated. Suboptimal free T4 and elevated thyroid antibodies can worsen insulin sensitivity and push fasting glucose higher over time.
- Free T4 is best interpreted in relation to TSH and clinical symptoms — a value of 0.85 ng/dL labeled "normal" can still represent meaningful metabolic drag.
- Lifestyle interventions — sleep, resistance training, fiber, fasting windows, and stress management — move fasting glucose meaningfully within 4–8 weeks.
- Targeted supplementation (berberine, ALA, chromium) has clinical evidence for improving fasting glucose and insulin sensitivity when dosed appropriately and indicated by actual lab findings — the approach Ones is built to deliver.
---
This article is for educational purposes only and does not constitute medical advice. Always consult a qualified healthcare provider before making changes to your supplement regimen or interpreting your lab results.